417 34th St NE Cedar Rapids, IA 52402
Kenwood Park NeighborhoodEstimated Value: $148,000 - $159,794
2
Beds
1
Bath
916
Sq Ft
$169/Sq Ft
Est. Value
About This Home
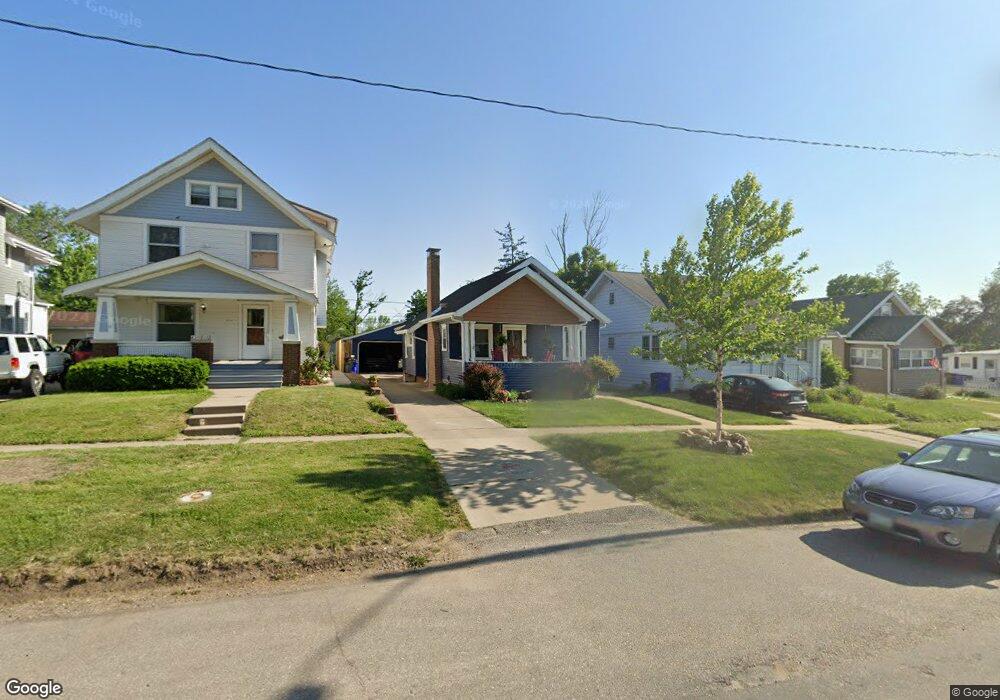
This home is located at 417 34th St NE, Cedar Rapids, IA 52402 and is currently estimated at $154,949, approximately $169 per square foot. 417 34th St NE is a home located in Linn County with nearby schools including Kenwood Leadership Academy, Franklin Middle School, and George Washington High School.
Ownership History
Date
Name
Owned For
Owner Type
Purchase Details
Closed on
Oct 14, 2005
Sold by
Cannizzaro Andrew B and Cannizzaro Ann M Carlson
Bought by
Young Matthew S and Young Jennifer A
Current Estimated Value
Home Financials for this Owner
Home Financials are based on the most recent Mortgage that was taken out on this home.
Original Mortgage
$117,350
Interest Rate
5.83%
Mortgage Type
Fannie Mae Freddie Mac
Purchase Details
Closed on
Jun 1, 1999
Sold by
Sindelar Catherine Ann and Sindelar Terry E
Bought by
Carlson Ann M
Home Financials for this Owner
Home Financials are based on the most recent Mortgage that was taken out on this home.
Original Mortgage
$89,017
Interest Rate
6.92%
Mortgage Type
FHA
Create a Home Valuation Report for This Property
The Home Valuation Report is an in-depth analysis detailing your home's value as well as a comparison with similar homes in the area
Home Values in the Area
Average Home Value in this Area
Purchase History
| Date | Buyer | Sale Price | Title Company |
|---|---|---|---|
| Young Matthew S | $120,500 | Midwest Community Title | |
| Carlson Ann M | $89,000 | -- |
Source: Public Records
Mortgage History
| Date | Status | Borrower | Loan Amount |
|---|---|---|---|
| Previous Owner | Young Matthew S | $117,350 | |
| Previous Owner | Carlson Ann M | $89,017 |
Source: Public Records
Tax History Compared to Growth
Tax History
| Year | Tax Paid | Tax Assessment Tax Assessment Total Assessment is a certain percentage of the fair market value that is determined by local assessors to be the total taxable value of land and additions on the property. | Land | Improvement |
|---|---|---|---|---|
| 2025 | $2,332 | $152,500 | $24,600 | $127,900 |
| 2024 | $2,472 | $146,900 | $24,600 | $122,300 |
| 2023 | $2,472 | $142,200 | $24,600 | $117,600 |
| 2022 | $2,258 | $126,100 | $22,500 | $103,600 |
| 2021 | $2,402 | $118,000 | $19,300 | $98,700 |
| 2020 | $2,402 | $117,500 | $19,300 | $98,200 |
| 2019 | $2,158 | $108,600 | $18,200 | $90,400 |
| 2018 | $2,094 | $108,600 | $18,200 | $90,400 |
| 2017 | $2,248 | $111,700 | $16,100 | $95,600 |
| 2016 | $2,265 | $106,600 | $16,100 | $90,500 |
| 2015 | $2,237 | $105,138 | $21,400 | $83,738 |
| 2014 | $2,052 | $107,755 | $21,400 | $86,355 |
| 2013 | $2,058 | $107,755 | $21,400 | $86,355 |
Source: Public Records
Map
Nearby Homes
- 3322 C Ave NE
- 413 34th St NE
- 419 33rd St NE
- 410 32nd St NE
- 615 34th St NE
- 628 33rd St NE
- 139 32nd St NE
- 232 31st St NE
- 3107 E Ave NE
- 3718 C Ave NE
- 727 37th St NE
- 650 Staub Ct NE
- 521 29th St NE
- 3817 Lennox Ave NE
- 209 30th Street Dr SE
- 3717 H Ave NE
- 1032 34th St NE
- 309 29th Street Dr SE
- 143 40th St NE
- 219 40th Street Dr SE Unit 206