Estimated Value: $654,876 - $800,000
5
Beds
4
Baths
5,037
Sq Ft
$149/Sq Ft
Est. Value
About This Home
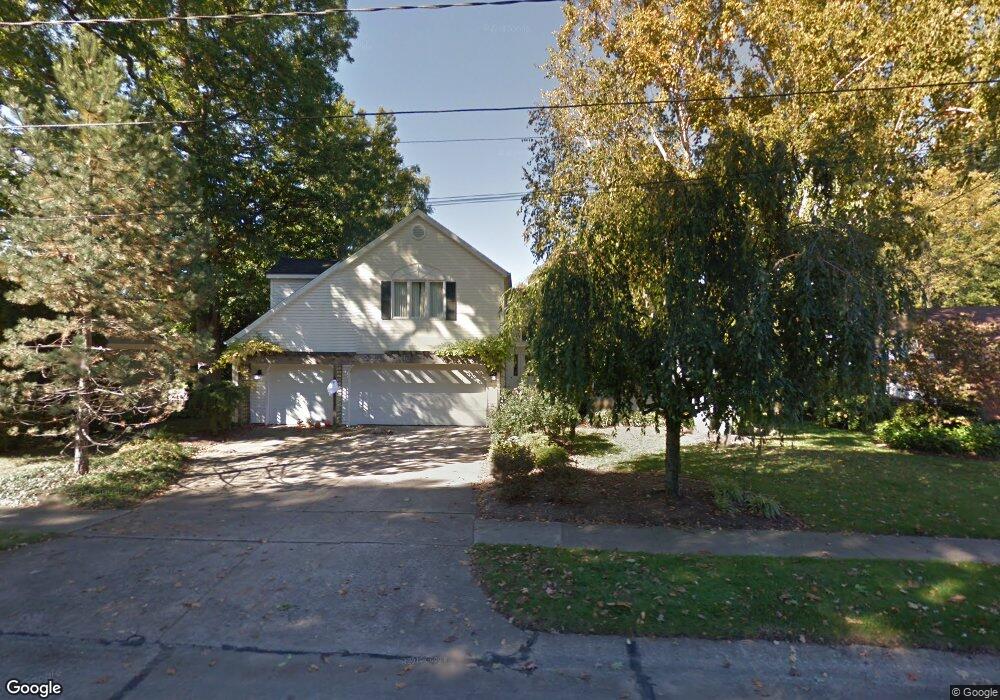
This home is located at 417 Anchorage Cir, Huron, OH 44839 and is currently estimated at $752,719, approximately $149 per square foot. 417 Anchorage Cir is a home located in Erie County with nearby schools including Shawnee Elementary School, Woodlands Intermediate School, and McCormick Junior High School.
Ownership History
Date
Name
Owned For
Owner Type
Purchase Details
Closed on
Sep 26, 2011
Sold by
Laffay Paul C and Laffay Elizabeth A
Bought by
Laffay Paul C and Laffay Elizabeth A
Current Estimated Value
Purchase Details
Closed on
Jul 26, 2010
Sold by
Will Jennifer H and Will Jennifer
Bought by
Laffay Paul C and Laffay Elizabeth A
Home Financials for this Owner
Home Financials are based on the most recent Mortgage that was taken out on this home.
Original Mortgage
$346,000
Outstanding Balance
$231,041
Interest Rate
4.74%
Mortgage Type
New Conventional
Estimated Equity
$521,678
Purchase Details
Closed on
Oct 22, 2008
Sold by
Will Carl
Bought by
Will Jennifer
Purchase Details
Closed on
Aug 21, 2002
Sold by
Showalter Jeanette R
Bought by
Will Carl E and Will Jennifer
Home Financials for this Owner
Home Financials are based on the most recent Mortgage that was taken out on this home.
Original Mortgage
$275,000
Interest Rate
6.63%
Mortgage Type
New Conventional
Create a Home Valuation Report for This Property
The Home Valuation Report is an in-depth analysis detailing your home's value as well as a comparison with similar homes in the area
Home Values in the Area
Average Home Value in this Area
Purchase History
| Date | Buyer | Sale Price | Title Company |
|---|---|---|---|
| Laffay Paul C | -- | Attorney | |
| Laffay Paul C | $432,500 | Lawyers Title Ins Corp | |
| Will Jennifer | -- | None Available | |
| Will Carl E | $365,000 | -- |
Source: Public Records
Mortgage History
| Date | Status | Borrower | Loan Amount |
|---|---|---|---|
| Open | Laffay Paul C | $346,000 | |
| Previous Owner | Will Carl E | $275,000 |
Source: Public Records
Tax History
| Year | Tax Paid | Tax Assessment Tax Assessment Total Assessment is a certain percentage of the fair market value that is determined by local assessors to be the total taxable value of land and additions on the property. | Land | Improvement |
|---|---|---|---|---|
| 2024 | $7,581 | $203,591 | $36,008 | $167,583 |
| 2023 | $7,815 | $157,738 | $27,699 | $130,039 |
| 2022 | $6,538 | $157,741 | $27,699 | $130,042 |
| 2021 | $6,520 | $157,740 | $27,700 | $130,040 |
| 2020 | $5,933 | $139,850 | $27,700 | $112,150 |
| 2019 | $6,195 | $139,850 | $27,700 | $112,150 |
| 2018 | $6,228 | $139,850 | $27,700 | $112,150 |
| 2017 | $5,894 | $128,640 | $26,040 | $102,600 |
| 2016 | $5,706 | $128,640 | $26,040 | $102,600 |
| 2015 | $5,700 | $128,640 | $26,040 | $102,600 |
| 2014 | $5,766 | $128,640 | $26,040 | $102,600 |
| 2013 | $5,684 | $128,640 | $26,040 | $102,600 |
Source: Public Records
Map
Nearby Homes
- 1100 By-The-shores Dr Unit 1
- 1120 By the Shores Dr Unit 2
- 1110 By the Shores Dr Unit 4
- 618 Cleveland Rd E
- 603 Ottawa Dr
- 1505 Cleveland Rd E Unit 331
- 1505 Cleveland Rd E Unit 334
- 613 Oneida View Place
- 419 Miami Place
- 508 Snowy Egret Dr
- 38 VL Youness
- 28 Turtle Bay
- 0 W Cleveland Rd
- 676 Salem Dr
- 128 N Port Ln
- 1140 Sheltered Brook Dr
- 0 Main St
- 317 Chevy Dr
- 927 Dallas Dr
- 418 Adams Ave
- 415 Anchorage Cir
- 419 Anchorage Cir
- 413 Anchorage Cir
- 421 Anchorage Cir
- 1004 Dockway Dr
- 1005 Cove Cir
- 1005 Dockway Dr
- 1007 Cove Cir
- 411 Anchorage Cir
- 420 Anchorage Cir
- 414 Anchorage Cir
- 1006 Dockway Dr
- 423 Anchorage Cir
- 422 Anchorage Cir
- 412 Anchorage Cir
- 1007 Dockway Dr
- 409 Anchorage Cir
- 1009 Cove Cir
- 1005 Harborview Dr
- 1008 Dockway Dr
Your Personal Tour Guide
Ask me questions while you tour the home.