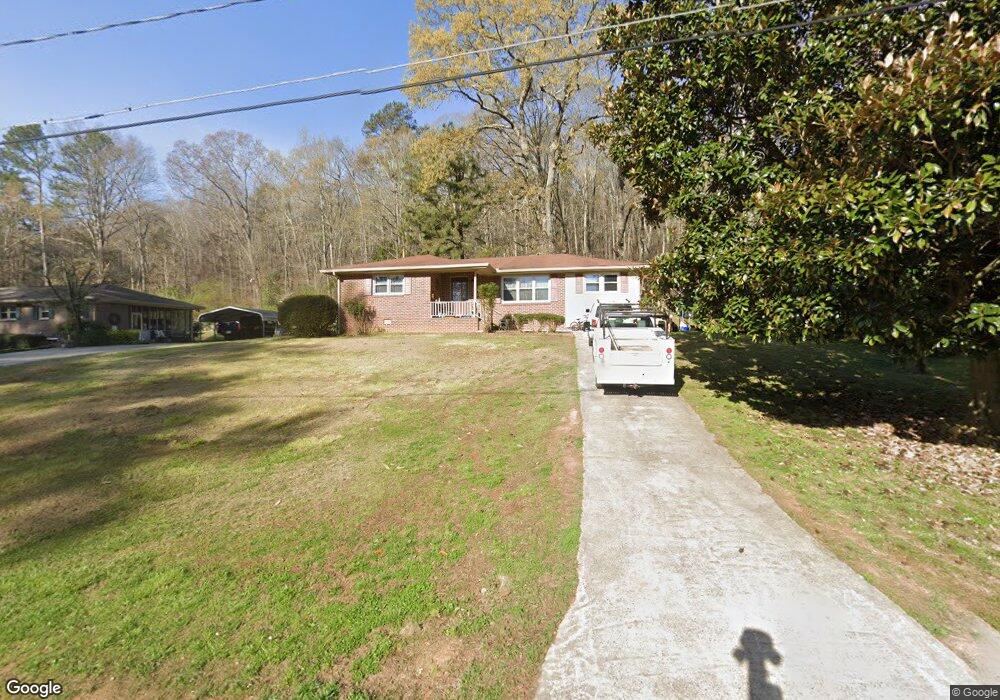
417 Blackberry Ln SE Lindale, GA 30147
Estimated Value: $185,000 - $203,000
3
Beds
1
Bath
1,292
Sq Ft
$149/Sq Ft
Est. Value
About This Home
This home is located at 417 Blackberry Ln SE, Lindale, GA 30147 and is currently estimated at $193,063, approximately $149 per square foot. 417 Blackberry Ln SE is a home located in Floyd County with nearby schools including Pepperell Middle School and Pepperell High School.
Ownership History
Date
Name
Owned For
Owner Type
Purchase Details
Closed on
Mar 12, 2020
Sold by
Pegg Corey Phillip
Bought by
Pegg Corey Phillip and Pegg Sarah Elaine
Current Estimated Value
Home Financials for this Owner
Home Financials are based on the most recent Mortgage that was taken out on this home.
Original Mortgage
$98,090
Outstanding Balance
$88,208
Interest Rate
4.12%
Mortgage Type
FHA
Estimated Equity
$88,749
Purchase Details
Closed on
Feb 18, 2019
Sold by
Montana Patricia
Bought by
Pendergraft Robert
Purchase Details
Closed on
Dec 8, 2008
Sold by
Wright Bonnell W
Bought by
Montana Patricia and Edge Lynn
Purchase Details
Closed on
Jun 4, 2002
Sold by
Wright Wright C and Wright Bonnell W
Bought by
Wright Bonnell W
Purchase Details
Closed on
Sep 21, 1994
Sold by
Wright Cc
Bought by
Wright Wright C and Wright Bonnell W
Purchase Details
Closed on
Jun 2, 1966
Sold by
Leithusr Don G
Bought by
Wright Cc
Create a Home Valuation Report for This Property
The Home Valuation Report is an in-depth analysis detailing your home's value as well as a comparison with similar homes in the area
Home Values in the Area
Average Home Value in this Area
Purchase History
| Date | Buyer | Sale Price | Title Company |
|---|---|---|---|
| Pegg Corey Phillip | -- | -- | |
| Pegg Corey Phillip | $99,900 | -- | |
| Pendergraft Robert | $85,000 | -- | |
| Montana Patricia | -- | -- | |
| Wright Bonnell W | -- | -- | |
| Wright Wright C | -- | -- | |
| Wright Cc | $12,500 | -- | |
| Leithusr Don G | -- | -- |
Source: Public Records
Mortgage History
| Date | Status | Borrower | Loan Amount |
|---|---|---|---|
| Open | Pegg Corey Phillip | $98,090 | |
| Closed | Pegg Corey Phillip | $98,090 |
Source: Public Records
Tax History Compared to Growth
Tax History
| Year | Tax Paid | Tax Assessment Tax Assessment Total Assessment is a certain percentage of the fair market value that is determined by local assessors to be the total taxable value of land and additions on the property. | Land | Improvement |
|---|---|---|---|---|
| 2024 | $1,926 | $60,165 | $9,680 | $50,485 |
| 2023 | $1,791 | $53,291 | $8,800 | $44,491 |
| 2022 | $1,366 | $43,662 | $7,040 | $36,622 |
| 2021 | $1,272 | $39,875 | $7,040 | $32,835 |
| 2020 | $1,072 | $33,101 | $5,280 | $27,821 |
| 2019 | $878 | $31,135 | $5,280 | $25,855 |
| 2018 | $839 | $29,139 | $5,280 | $23,859 |
| 2017 | $818 | $28,383 | $5,280 | $23,103 |
| 2016 | $820 | $28,102 | $5,280 | $22,822 |
| 2015 | $806 | $28,102 | $5,280 | $22,822 |
| 2014 | $806 | $28,102 | $5,280 | $22,822 |
Source: Public Records
Map
Nearby Homes
- 407 Blackberry Ln SE
- 27 Hughes Dairy Rd SE
- 0 Booze Mountain Rd Unit 10580353
- 792 Park Ave SE
- 26 The Trail SE
- 81 Hughes Dairy Rd
- 305 Grove Ave SE
- 184 Conns Lake Extension
- 1572 Booze Mountain Rd SE
- 202 Park Ave SE
- 612 Eden Valley Rd SE
- 13 N Terrace Ave SE
- 135 Reeceburg Rd SE
- 514 Booze Mountain Rd SE
- 1380 Old Cedartown Rd SE
- 12 Indian River Rd SE
- 0 S Edenfield Ridge Dr SE
- 12 Circle Dr SE
- 0 Edenfield Dr SE Unit 21222627
- 113 Avenue D SE
- 415 Blackberry Ln SE
- 419 Blackberry Ln SE
- 0 Blackberry Ln SE Unit 8689387
- 0 Blackberry Ln SE Unit 3203197
- 0 Blackberry Ln SE Unit 7057669
- 0 Blackberry Ln SE Unit 7196666
- 0 Blackberry Ln SE Unit 7453098
- 0 Blackberry Ln SE Unit 8463338
- 0 Blackberry Ln SE
- 418 Blackberry Ln SE
- 416 Blackberry Ln SE
- 413 Blackberry Ln SE
- 421 Blackberry Ln SE
- 420 Blackberry Ln SE
- 422 Blackberry Ln SE
- 412 Blackberry Ln SE
- 411 Blackberry Ln SE
- 423 Blackberry Ln SE
- 407 Spring Village Rd SE
- 405 Spring Village Rd SE Unit 70