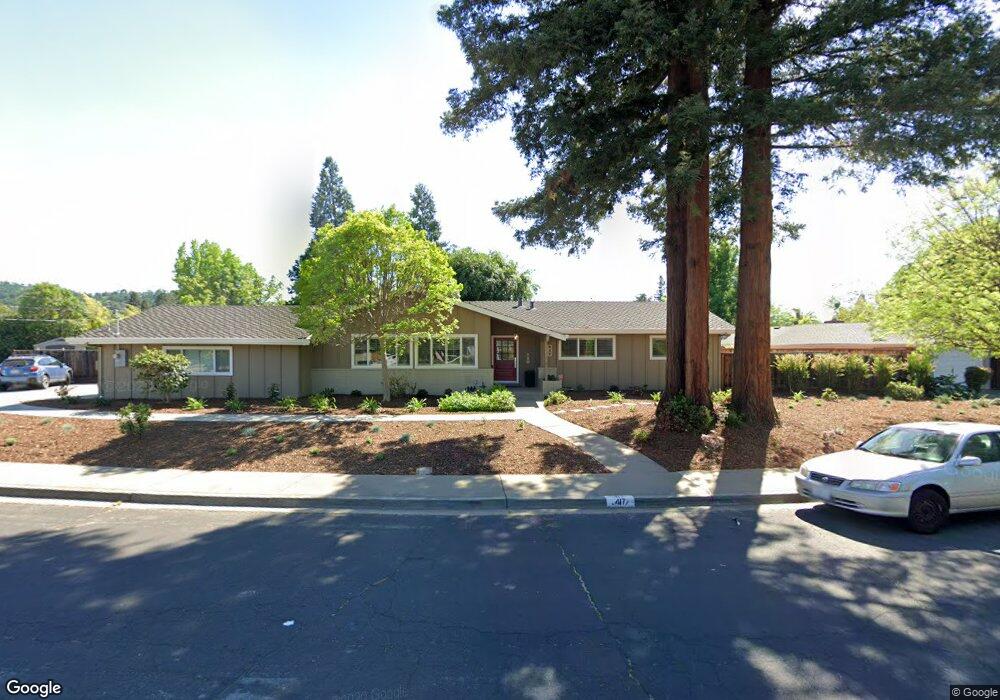
417 Fenway Dr Walnut Creek, CA 94598
Brooktree North NeighborhoodEstimated Value: $1,532,000 - $1,920,000
4
Beds
2
Baths
2,032
Sq Ft
$833/Sq Ft
Est. Value
About This Home
This home is located at 417 Fenway Dr, Walnut Creek, CA 94598 and is currently estimated at $1,691,920, approximately $832 per square foot. 417 Fenway Dr is a home located in Contra Costa County with nearby schools including Walnut Acres Elementary School, Foothill Middle School, and Northgate High School.
Ownership History
Date
Name
Owned For
Owner Type
Purchase Details
Closed on
Oct 14, 2015
Sold by
Butler Nancy Jean and Handlan Beverly Ann
Bought by
The Joseph F Herger & Vicki Smith Trust
Current Estimated Value
Home Financials for this Owner
Home Financials are based on the most recent Mortgage that was taken out on this home.
Original Mortgage
$170,000
Outstanding Balance
$68,860
Interest Rate
3.85%
Mortgage Type
New Conventional
Estimated Equity
$1,623,060
Purchase Details
Closed on
Aug 5, 2009
Sold by
Butler Nancy Jean and Handlan Beverly Ann
Bought by
Butler Nancy Jean and Handlan Beverly Ann
Purchase Details
Closed on
Jul 22, 2009
Sold by
Skirvin Robert W and Skirvin Elizabeth A
Bought by
Skirvin Robert W and Skirvin Elizabeth A
Create a Home Valuation Report for This Property
The Home Valuation Report is an in-depth analysis detailing your home's value as well as a comparison with similar homes in the area
Home Values in the Area
Average Home Value in this Area
Purchase History
| Date | Buyer | Sale Price | Title Company |
|---|---|---|---|
| The Joseph F Herger & Vicki Smith Trust | $1,005,000 | Old Republic Title Company | |
| Butler Nancy Jean | -- | Old Republic Title Company | |
| Skirvin Robert W | -- | None Available | |
| Skirvin Robert W | -- | None Available |
Source: Public Records
Mortgage History
| Date | Status | Borrower | Loan Amount |
|---|---|---|---|
| Open | The Joseph F Herger & Vicki Smith Trust | $170,000 |
Source: Public Records
Tax History
| Year | Tax Paid | Tax Assessment Tax Assessment Total Assessment is a certain percentage of the fair market value that is determined by local assessors to be the total taxable value of land and additions on the property. | Land | Improvement |
|---|---|---|---|---|
| 2025 | $13,858 | $1,189,712 | $893,765 | $295,947 |
| 2024 | $13,319 | $1,166,386 | $876,241 | $290,145 |
| 2023 | $13,319 | $1,143,516 | $859,060 | $284,456 |
| 2022 | $13,202 | $1,121,095 | $842,216 | $278,879 |
| 2021 | $12,909 | $1,099,113 | $825,702 | $273,411 |
| 2019 | $12,648 | $1,066,514 | $801,212 | $265,302 |
| 2018 | $12,190 | $1,045,602 | $785,502 | $260,100 |
| 2017 | $11,883 | $1,025,100 | $770,100 | $255,000 |
| 2016 | $11,676 | $1,005,000 | $755,000 | $250,000 |
| 2015 | $1,716 | $113,921 | $39,222 | $74,699 |
| 2014 | $1,670 | $111,690 | $38,454 | $73,236 |
Source: Public Records
Map
Nearby Homes
- 2851 San Antonio Dr
- 289 El Divisadero Ave
- 1032 Millbrook Ct
- 1919 Ygnacio Valley Rd Unit 93
- 920 Cochise Ct
- 3085 Avellano Dr
- 831 Tampico
- 126 Ready Rd
- 582 La Corso Dr
- 208 Siskiyou Ct
- 2737 Harland Ct
- 1936 Nero Ct
- 1434 Los Vecinos
- 196 Wilkie Dr
- 652 Savoy Ct
- 1407 Marchbanks Dr Unit 3
- 1445 Marchbanks Dr Unit 2
- 1417 Marchbanks Dr Unit 4
- 1443 Marchbanks Dr Unit 2
- 411 La Vista Rd
- 1925 Blackstone Dr
- 463 Fenway Dr
- 1915 Blackstone Dr
- 414 Fenway Dr
- 448 Fenway Dr
- 475 Fenway Dr
- 402 Fenway Dr
- 460 Fenway Dr
- 16 Fenway Ct
- 435 Warwick Dr
- 1905 Blackstone Dr
- 19 Fenway Ct
- 472 Fenway Dr
- 445 Warwick Dr
- 15 Fenway Ct
- 399 Fenway Dr
- 1955 Blackstone Dr
- 459 Warwick Dr
- 39 Las Lomas Way
- 53 Las Lomas Way
Your Personal Tour Guide
Ask me questions while you tour the home.