417 Gamble St Columbus Junction, IA 52738
Estimated Value: $127,319 - $178,000
3
Beds
1
Bath
1,478
Sq Ft
$101/Sq Ft
Est. Value
About This Home
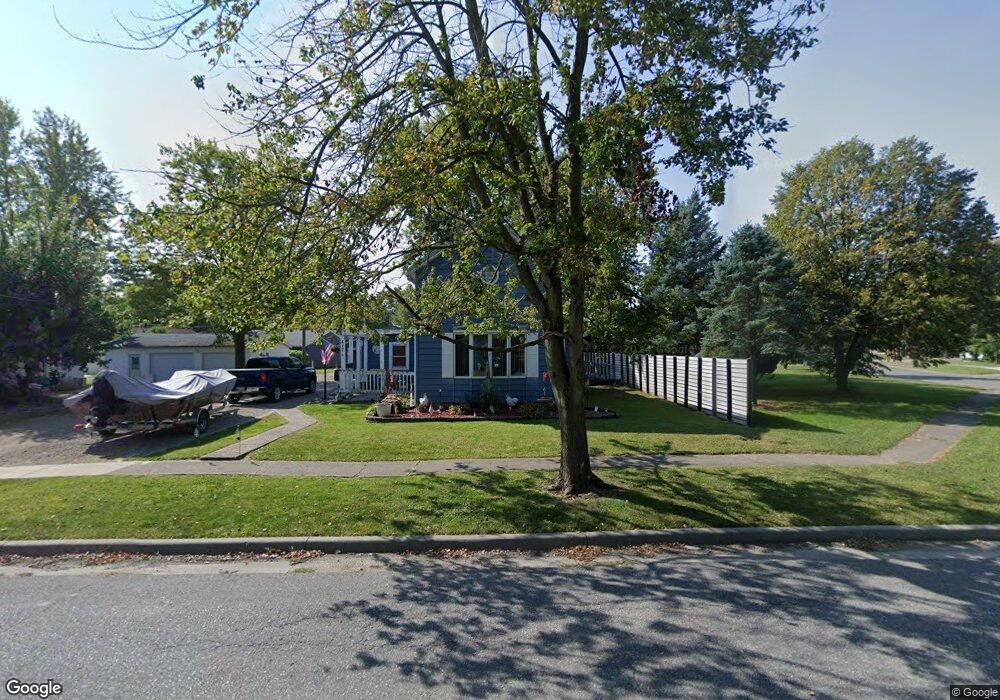
This home is located at 417 Gamble St, Columbus Junction, IA 52738 and is currently estimated at $148,580, approximately $100 per square foot. 417 Gamble St is a home located in Louisa County with nearby schools including Roundy Elementary School and Columbus Community High School.
Ownership History
Date
Name
Owned For
Owner Type
Purchase Details
Closed on
Oct 12, 2018
Sold by
Bright Alicia
Bought by
Bright Bill
Current Estimated Value
Purchase Details
Closed on
May 23, 2007
Sold by
White Cynthia D and Beck Cynthia
Bought by
Bright Bill and Bright Alicia
Home Financials for this Owner
Home Financials are based on the most recent Mortgage that was taken out on this home.
Original Mortgage
$64,000
Outstanding Balance
$39,014
Interest Rate
6.21%
Mortgage Type
New Conventional
Estimated Equity
$109,566
Create a Home Valuation Report for This Property
The Home Valuation Report is an in-depth analysis detailing your home's value as well as a comparison with similar homes in the area
Home Values in the Area
Average Home Value in this Area
Purchase History
| Date | Buyer | Sale Price | Title Company |
|---|---|---|---|
| Bright Bill | -- | None Available | |
| Bright Bill | $80,000 | None Available |
Source: Public Records
Mortgage History
| Date | Status | Borrower | Loan Amount |
|---|---|---|---|
| Open | Bright Bill | $64,000 |
Source: Public Records
Tax History Compared to Growth
Tax History
| Year | Tax Paid | Tax Assessment Tax Assessment Total Assessment is a certain percentage of the fair market value that is determined by local assessors to be the total taxable value of land and additions on the property. | Land | Improvement |
|---|---|---|---|---|
| 2025 | $1,324 | $100,220 | $11,450 | $88,770 |
| 2024 | $1,302 | $85,040 | $11,450 | $73,590 |
| 2023 | $1,390 | $85,040 | $11,450 | $73,590 |
| 2022 | $1,342 | $77,340 | $11,450 | $65,890 |
| 2021 | $1,188 | $77,340 | $11,450 | $65,890 |
| 2020 | $1,188 | $63,550 | $11,450 | $52,100 |
| 2019 | $1,294 | $63,550 | $11,450 | $52,100 |
| 2018 | $1,260 | $63,550 | $11,450 | $52,100 |
| 2017 | $1,260 | $71,810 | $0 | $0 |
| 2016 | $1,576 | $71,810 | $6,910 | $64,900 |
| 2015 | $1,576 | $71,810 | $6,910 | $64,900 |
| 2014 | $1,498 | $71,810 | $6,910 | $64,900 |
Source: Public Records
Map
Nearby Homes
- 303 Gamble St
- 824 3rd St
- 804 Union St
- 1175 Oakview Dr
- 209 Flat Iron Dr
- 830 Colonial Ave
- 409 2nd St
- 0 Iowa 92
- 2209 Philadelphia St
- 260 Colonels Dr
- 2902 Water St
- 00 140th St
- 000 140th St
- 20513 County Road G40
- 13483 County Road W66
- 17297 Highway 92
- 17297 Iowa 92
- 18173 115th St
- 17297 State Hwy 92
- 9996 W Ave