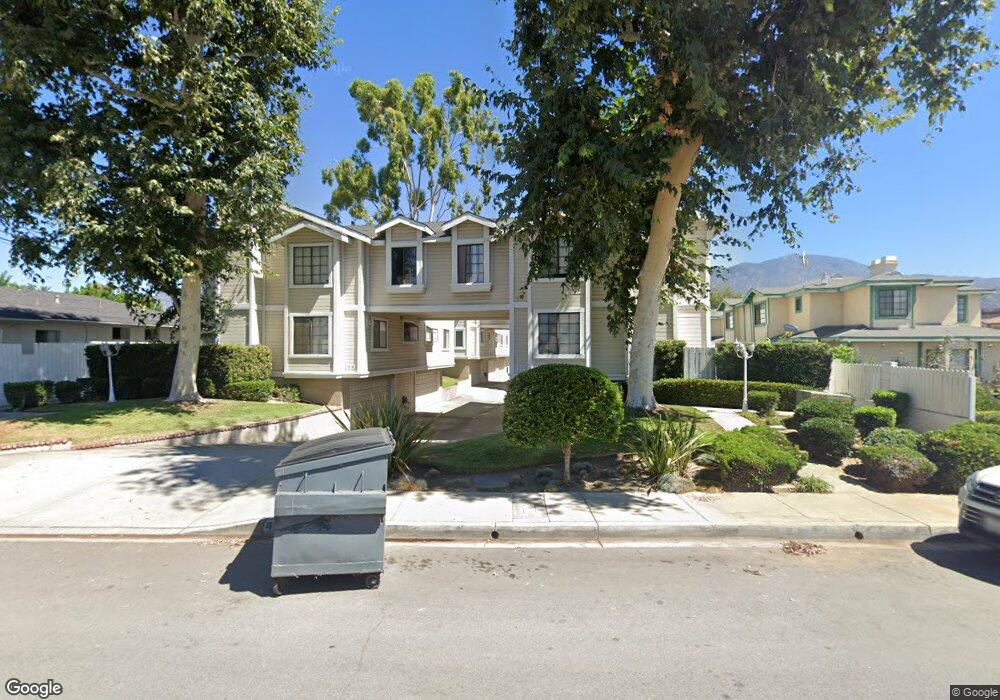
417 Genoa St Unit A Monrovia, CA 91016
Estimated Value: $611,751 - $662,000
3
Beds
2
Baths
1,232
Sq Ft
$521/Sq Ft
Est. Value
About This Home
This home is located at 417 Genoa St Unit A, Monrovia, CA 91016 and is currently estimated at $642,438, approximately $521 per square foot. 417 Genoa St Unit A is a home located in Los Angeles County with nearby schools including Wild Rose Elementary School, Santa Fe Computer Science Magnet, and Monrovia High School.
Ownership History
Date
Name
Owned For
Owner Type
Purchase Details
Closed on
Jul 16, 2003
Sold by
Mele Pino
Bought by
Candilora Danielle
Current Estimated Value
Purchase Details
Closed on
Dec 9, 2002
Sold by
Leibl Todd
Bought by
Mele Pino and Mele Danielle
Home Financials for this Owner
Home Financials are based on the most recent Mortgage that was taken out on this home.
Original Mortgage
$211,500
Outstanding Balance
$89,017
Interest Rate
5.96%
Mortgage Type
Purchase Money Mortgage
Estimated Equity
$553,421
Purchase Details
Closed on
Feb 25, 1997
Sold by
Torres Paul R
Bought by
Leibl Todd W and Leibl Elaine
Purchase Details
Closed on
Nov 18, 1994
Sold by
Mar Mich
Bought by
Torres Paul R
Home Financials for this Owner
Home Financials are based on the most recent Mortgage that was taken out on this home.
Original Mortgage
$121,500
Interest Rate
8.9%
Mortgage Type
Seller Take Back
Create a Home Valuation Report for This Property
The Home Valuation Report is an in-depth analysis detailing your home's value as well as a comparison with similar homes in the area
Home Values in the Area
Average Home Value in this Area
Purchase History
| Date | Buyer | Sale Price | Title Company |
|---|---|---|---|
| Candilora Danielle | -- | -- | |
| Mele Pino | $235,000 | Chicago Title Co | |
| Leibl Todd W | -- | Chicago Title | |
| Torres Paul R | $135,000 | Chicago Title |
Source: Public Records
Mortgage History
| Date | Status | Borrower | Loan Amount |
|---|---|---|---|
| Open | Mele Pino | $211,500 | |
| Previous Owner | Torres Paul R | $121,500 |
Source: Public Records
Tax History
| Year | Tax Paid | Tax Assessment Tax Assessment Total Assessment is a certain percentage of the fair market value that is determined by local assessors to be the total taxable value of land and additions on the property. | Land | Improvement |
|---|---|---|---|---|
| 2025 | $4,751 | $340,332 | $202,030 | $138,302 |
| 2024 | $4,751 | $333,660 | $198,069 | $135,591 |
| 2023 | $4,643 | $327,119 | $194,186 | $132,933 |
| 2022 | $4,510 | $320,706 | $190,379 | $130,327 |
| 2021 | $4,420 | $314,419 | $186,647 | $127,772 |
| 2019 | $4,215 | $305,095 | $181,112 | $123,983 |
| 2018 | $4,122 | $299,113 | $177,561 | $121,552 |
| 2016 | $3,961 | $287,500 | $170,667 | $116,833 |
| 2015 | $3,876 | $283,183 | $168,104 | $115,079 |
| 2014 | $3,840 | $277,637 | $164,812 | $112,825 |
Source: Public Records
Map
Nearby Homes
- 331 Genoa St Unit E
- 537 Diamond St
- 1218 S Mayflower Ave Unit B
- 714 Genoa St
- 151 E El Norte St
- 2032 Graydon Ave
- 148 W Cherry Ave
- 1100 S 9th Ave
- 1131 S 10th Ave
- 511 W Maple Ave
- 1227 S 8th Ave
- 1318 S 8th Ave
- 1118 S 6th Ave
- 910 S 5th Ave
- 601 S 5th Ave Unit B
- 424 Genoa St
- 527 S 5th Ave Unit B
- 523 S 5th Ave Unit B
- 709 S Magnolia Ave
- 215 S 5th Ave Unit A
- 417 Genoa St Unit B
- 417 Genoa St Unit C
- 417 Genoa St Unit D
- 419 Genoa St Unit B
- 419 Genoa St Unit A
- 415 Genoa St Unit A
- 415 Genoa St Unit B
- 421 Genoa St Unit D
- 421 Genoa St Unit C
- 421 Genoa St Unit B
- 421 Genoa St Unit A
- 429 Genoa St Unit B
- 429 Genoa St
- 409 Genoa St
- 405 Genoa St
- 427 Genoa St Unit B
- 427 Genoa St
- 1628 S Mayflower Ave Unit G
- 1628 S Mayflower Ave Unit H
- 1628 S Mayflower Ave Unit F
Your Personal Tour Guide
Ask me questions while you tour the home.