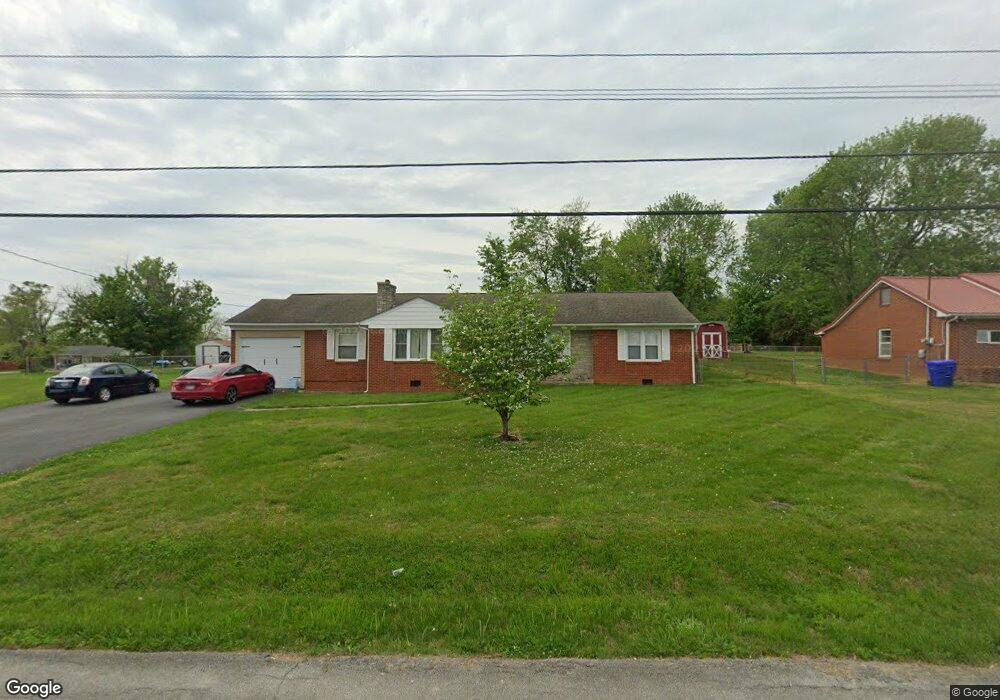
417 Lee R Morristown, TN 37814
Estimated Value: $260,000 - $333,000
--
Bed
2
Baths
1,717
Sq Ft
$164/Sq Ft
Est. Value
About This Home
This home is located at 417 Lee R, Morristown, TN 37814 and is currently estimated at $281,886, approximately $164 per square foot. 417 Lee R is a home located in Hamblen County with nearby schools including Manley Elementary School, West View Middle School, and Morristown West High School.
Ownership History
Date
Name
Owned For
Owner Type
Purchase Details
Closed on
Nov 9, 2019
Sold by
Whaley Anthony J and Whaley Nancy A
Bought by
Hefner Kasey M
Current Estimated Value
Home Financials for this Owner
Home Financials are based on the most recent Mortgage that was taken out on this home.
Original Mortgage
$162,000
Outstanding Balance
$142,319
Interest Rate
3.53%
Mortgage Type
New Conventional
Estimated Equity
$139,567
Purchase Details
Closed on
Jan 4, 2012
Sold by
Springleaf Financial
Bought by
Whaley Anthony J and Whaley Nancy A
Purchase Details
Closed on
Sep 29, 2011
Sold by
Rucker Glenda O
Bought by
Springleaf Financial
Purchase Details
Closed on
Jul 6, 1987
Bought by
Rucker Adrian and Rucker Glenda
Purchase Details
Closed on
Jan 7, 1977
Bought by
Martin David A
Create a Home Valuation Report for This Property
The Home Valuation Report is an in-depth analysis detailing your home's value as well as a comparison with similar homes in the area
Home Values in the Area
Average Home Value in this Area
Purchase History
| Date | Buyer | Sale Price | Title Company |
|---|---|---|---|
| Hefner Kasey M | $162,000 | None Available | |
| Whaley Anthony J | $56,500 | -- | |
| Springleaf Financial | $73,276 | -- | |
| Rucker Adrian | $51,000 | -- | |
| Martin David A | $32,000 | -- |
Source: Public Records
Mortgage History
| Date | Status | Borrower | Loan Amount |
|---|---|---|---|
| Open | Hefner Kasey M | $162,000 |
Source: Public Records
Tax History Compared to Growth
Tax History
| Year | Tax Paid | Tax Assessment Tax Assessment Total Assessment is a certain percentage of the fair market value that is determined by local assessors to be the total taxable value of land and additions on the property. | Land | Improvement |
|---|---|---|---|---|
| 2024 | $558 | $31,725 | $5,600 | $26,125 |
| 2023 | $558 | $31,725 | $0 | $0 |
| 2022 | $1,002 | $31,725 | $5,600 | $26,125 |
| 2021 | $1,002 | $31,725 | $5,600 | $26,125 |
| 2020 | $1,001 | $31,725 | $5,600 | $26,125 |
| 2019 | $890 | $26,175 | $6,100 | $20,075 |
| 2018 | $824 | $26,175 | $6,100 | $20,075 |
| 2017 | $811 | $26,175 | $6,100 | $20,075 |
| 2016 | $775 | $26,175 | $6,100 | $20,075 |
| 2015 | $721 | $26,175 | $6,100 | $20,075 |
| 2014 | -- | $26,175 | $6,100 | $20,075 |
| 2013 | -- | $27,150 | $0 | $0 |
Source: Public Records
Map
Nearby Homes
- 400 Drinnon Dr
- 700 Drinnon Dr
- 801 Colonial Dr
- 3475 Walden Dr
- 3471 Walden Dr
- 2978 Wilshire Blvd
- 490 E Sunset Hills
- 3542 Wedgewood Dr
- 1054 Colonial Dr
- 1086 St Ives Ct
- 725 Barton Dr
- 2444 Sandstone Dr
- 2454 Sandstone Dr
- 2430 Sandstone Dr
- 2310 Sandstone Dr
- 2045 N Economy Rd Unit A3
- 3641 Meadowland Dr
- 837 Foxglove Ln
- 941 Heykoop Dr
- 1033 Walters Dr