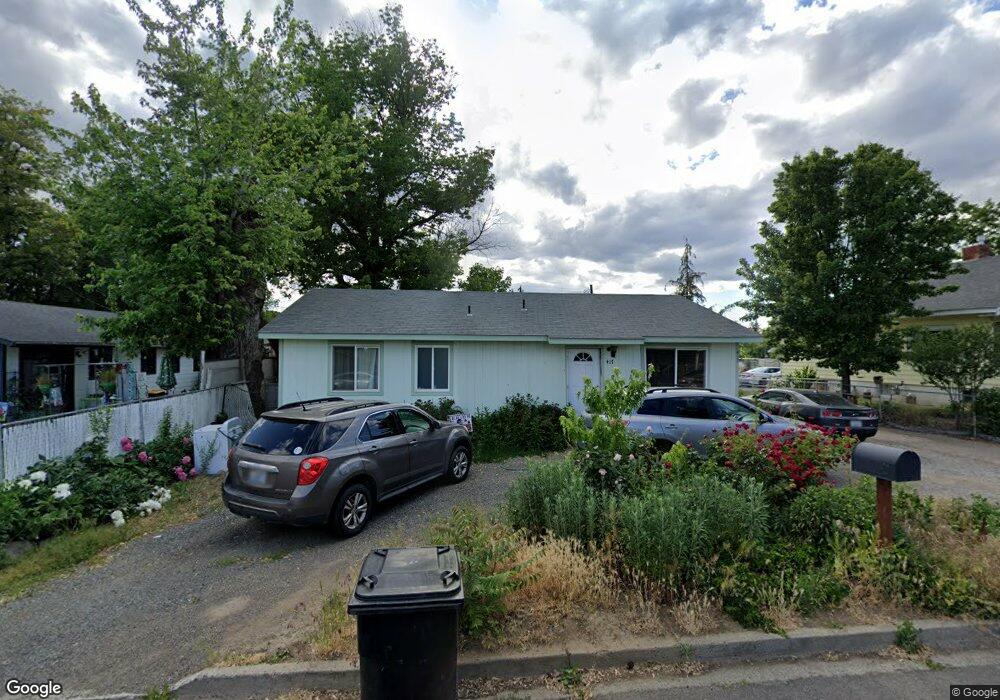
417 Maple Ct Toppenish, WA 98948
Estimated Value: $250,000 - $297,000
3
Beds
2
Baths
1,120
Sq Ft
$245/Sq Ft
Est. Value
About This Home
This home is located at 417 Maple Ct, Toppenish, WA 98948 and is currently estimated at $274,485, approximately $245 per square foot. 417 Maple Ct is a home located in Yakima County with nearby schools including Toppenish High School.
Ownership History
Date
Name
Owned For
Owner Type
Purchase Details
Closed on
Feb 18, 1998
Sold by
Hernandez Josefa
Bought by
Hernandez Demetrio
Current Estimated Value
Home Financials for this Owner
Home Financials are based on the most recent Mortgage that was taken out on this home.
Original Mortgage
$44,900
Outstanding Balance
$7,927
Interest Rate
6.97%
Estimated Equity
$266,558
Purchase Details
Closed on
Jul 29, 1996
Sold by
Shirley Pamela G
Bought by
Lloyd Cook Rentals Llc
Create a Home Valuation Report for This Property
The Home Valuation Report is an in-depth analysis detailing your home's value as well as a comparison with similar homes in the area
Home Values in the Area
Average Home Value in this Area
Purchase History
| Date | Buyer | Sale Price | Title Company |
|---|---|---|---|
| Hernandez Demetrio | -- | Schreiner Title Company | |
| Hernandez Demetrio | $47,300 | Schreiner Title Company | |
| Lloyd Cook Rentals Llc | $25,000 | -- |
Source: Public Records
Mortgage History
| Date | Status | Borrower | Loan Amount |
|---|---|---|---|
| Open | Hernandez Demetrio | $44,900 |
Source: Public Records
Tax History Compared to Growth
Tax History
| Year | Tax Paid | Tax Assessment Tax Assessment Total Assessment is a certain percentage of the fair market value that is determined by local assessors to be the total taxable value of land and additions on the property. | Land | Improvement |
|---|---|---|---|---|
| 2025 | $2,146 | $250,500 | $33,900 | $216,600 |
| 2023 | $1,996 | $199,200 | $33,700 | $165,500 |
| 2022 | $1,782 | $158,100 | $34,200 | $123,900 |
| 2021 | $1,994 | $142,600 | $30,700 | $111,900 |
| 2019 | $1,486 | $127,400 | $27,200 | $100,200 |
| 2018 | $1,178 | $100,300 | $26,100 | $74,200 |
| 2017 | $993 | $94,900 | $26,100 | $68,800 |
| 2016 | $988 | $95,850 | $26,050 | $69,800 |
| 2015 | $988 | $91,750 | $26,050 | $65,700 |
| 2014 | $988 | $91,750 | $26,050 | $65,700 |
| 2013 | $988 | $91,750 | $26,050 | $65,700 |
Source: Public Records
Map
Nearby Homes