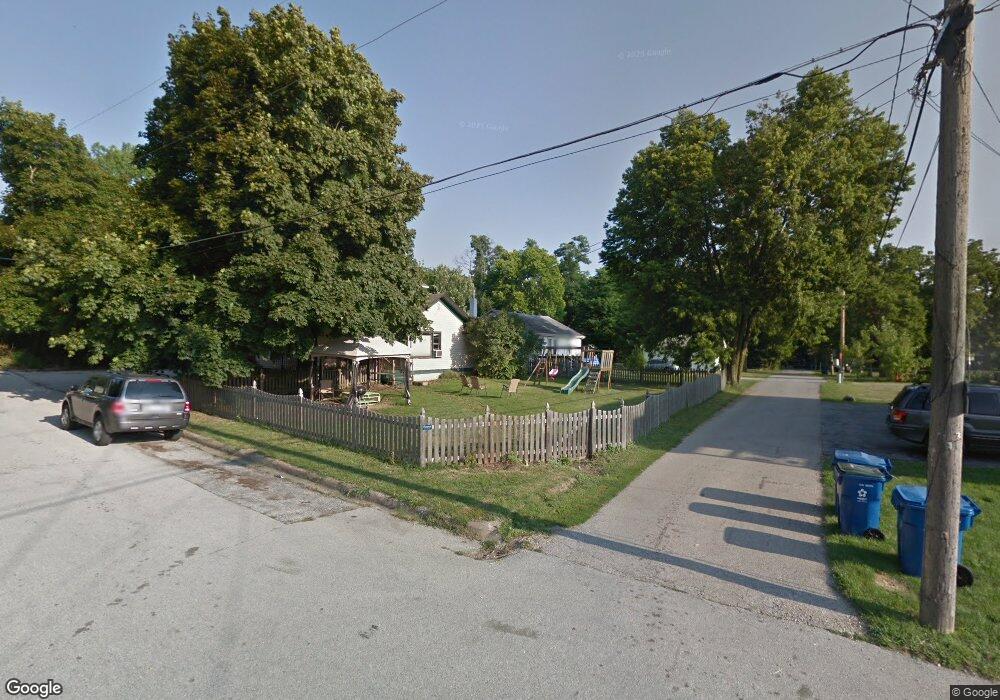
417 N 2nd St Le Claire, IA 52753
Estimated Value: $144,000 - $167,000
1
Bed
1
Bath
784
Sq Ft
$195/Sq Ft
Est. Value
About This Home
This home is located at 417 N 2nd St, Le Claire, IA 52753 and is currently estimated at $153,207, approximately $195 per square foot. 417 N 2nd St is a home located in Scott County with nearby schools including Cody Elementary School, Pleasant Valley Junior High School, and Pleasant Valley High School.
Ownership History
Date
Name
Owned For
Owner Type
Purchase Details
Closed on
Sep 27, 2024
Sold by
Fullmer Robert E and Fullmer Linda K
Bought by
Kruse Christopher Steven
Current Estimated Value
Purchase Details
Closed on
Oct 26, 2023
Sold by
Bach Investments Llc
Bought by
Fullmer Robert E and Fullmer Linda K
Purchase Details
Closed on
Apr 13, 2015
Sold by
Smith Janelle E
Bought by
Bach Investments Llc
Purchase Details
Closed on
May 1, 2008
Sold by
Corson Evelyn F
Bought by
Smith Janelle E
Home Financials for this Owner
Home Financials are based on the most recent Mortgage that was taken out on this home.
Original Mortgage
$68,400
Interest Rate
5.88%
Mortgage Type
Purchase Money Mortgage
Create a Home Valuation Report for This Property
The Home Valuation Report is an in-depth analysis detailing your home's value as well as a comparison with similar homes in the area
Home Values in the Area
Average Home Value in this Area
Purchase History
| Date | Buyer | Sale Price | Title Company |
|---|---|---|---|
| Kruse Christopher Steven | -- | None Listed On Document | |
| Fullmer Robert E | $130,000 | None Listed On Document | |
| Bach Investments Llc | $76,000 | None Available | |
| Smith Janelle E | $76,000 | None Available |
Source: Public Records
Mortgage History
| Date | Status | Borrower | Loan Amount |
|---|---|---|---|
| Previous Owner | Smith Janelle E | $68,400 |
Source: Public Records
Tax History Compared to Growth
Tax History
| Year | Tax Paid | Tax Assessment Tax Assessment Total Assessment is a certain percentage of the fair market value that is determined by local assessors to be the total taxable value of land and additions on the property. | Land | Improvement |
|---|---|---|---|---|
| 2025 | $1,812 | $136,800 | $48,900 | $87,900 |
| 2024 | $1,840 | $119,400 | $48,900 | $70,500 |
| 2023 | $1,918 | $119,400 | $48,900 | $70,500 |
| 2022 | $1,898 | $105,420 | $39,250 | $66,170 |
| 2021 | $1,898 | $105,420 | $39,250 | $66,170 |
| 2020 | $1,636 | $86,950 | $28,090 | $58,860 |
| 2019 | $1,488 | $76,920 | $18,060 | $58,860 |
| 2018 | $1,472 | $76,920 | $18,060 | $58,860 |
| 2017 | $1,458 | $76,920 | $18,060 | $58,860 |
| 2016 | $1,448 | $73,140 | $0 | $0 |
| 2015 | $1,448 | $0 | $0 | $0 |
| 2014 | $1,234 | $70,330 | $0 | $0 |
| 2013 | $1,216 | $0 | $0 | $0 |
| 2012 | -- | $70,330 | $18,060 | $52,270 |
Source: Public Records
Map
Nearby Homes