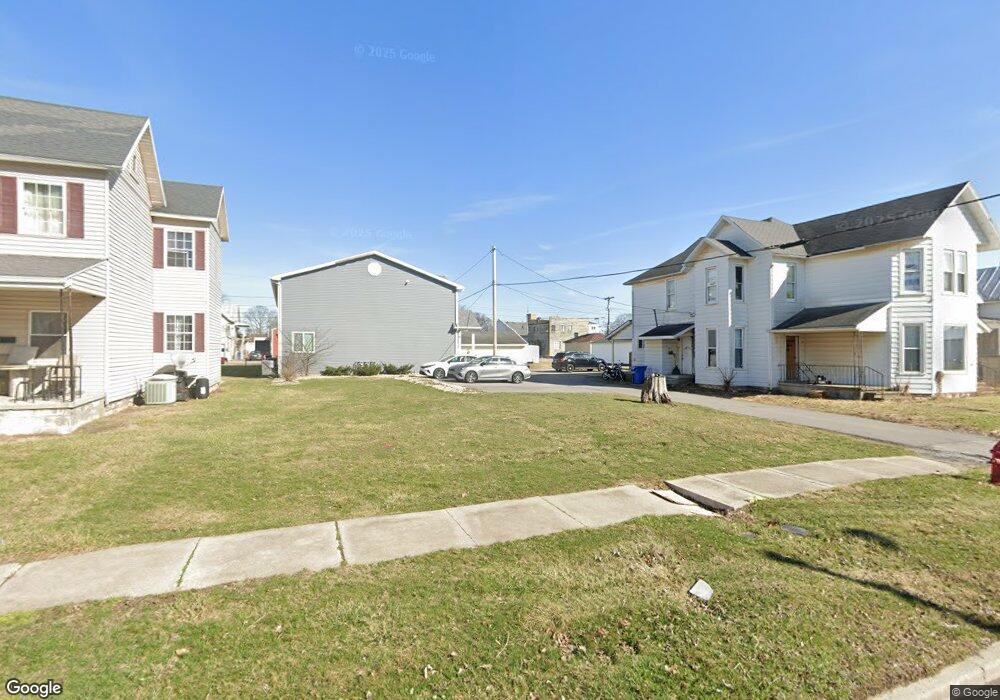
417 N Cory St Findlay, OH 45840
Estimated Value: $233,000 - $357,000
6
Beds
3
Baths
4,032
Sq Ft
$73/Sq Ft
Est. Value
About This Home
This home is located at 417 N Cory St, Findlay, OH 45840 and is currently estimated at $295,000, approximately $73 per square foot. 417 N Cory St is a home located in Hancock County with nearby schools including Whittier Primary School, Bigelow Hill Elementary School, and Glenwood Middle School.
Ownership History
Date
Name
Owned For
Owner Type
Purchase Details
Closed on
Dec 15, 2025
Sold by
L & M Properties Ltd
Bought by
Hubbuch Philip R
Current Estimated Value
Home Financials for this Owner
Home Financials are based on the most recent Mortgage that was taken out on this home.
Original Mortgage
$428,600
Outstanding Balance
$428,600
Interest Rate
6.17%
Mortgage Type
New Conventional
Estimated Equity
-$133,600
Purchase Details
Closed on
Jan 11, 2016
Bought by
L & M Properties Ltd
Home Financials for this Owner
Home Financials are based on the most recent Mortgage that was taken out on this home.
Interest Rate
3.97%
Purchase Details
Closed on
Aug 30, 1988
Bought by
Kelly Lawrence E and Kelly Cherry
Purchase Details
Closed on
Aug 21, 1987
Bought by
Csl Savings Bank
Purchase Details
Closed on
May 23, 1984
Bought by
Multi Town Properties Inc
Purchase Details
Closed on
Jan 11, 1984
Bought by
Baer David L
Create a Home Valuation Report for This Property
The Home Valuation Report is an in-depth analysis detailing your home's value as well as a comparison with similar homes in the area
Home Values in the Area
Average Home Value in this Area
Purchase History
| Date | Buyer | Sale Price | Title Company |
|---|---|---|---|
| Hubbuch Philip R | $451,266 | Flag City Title | |
| L & M Properties Ltd | $6,500 | -- | |
| Kelly Lawrence E | $42,500 | -- | |
| Csl Savings Bank | -- | -- | |
| Multi Town Properties Inc | -- | -- | |
| Baer David L | -- | -- |
Source: Public Records
Mortgage History
| Date | Status | Borrower | Loan Amount |
|---|---|---|---|
| Open | Hubbuch Philip R | $428,600 | |
| Previous Owner | L & M Properties Ltd | -- |
Source: Public Records
Tax History Compared to Growth
Tax History
| Year | Tax Paid | Tax Assessment Tax Assessment Total Assessment is a certain percentage of the fair market value that is determined by local assessors to be the total taxable value of land and additions on the property. | Land | Improvement |
|---|---|---|---|---|
| 2024 | $3,023 | $82,930 | $5,460 | $77,470 |
| 2023 | $199 | $5,460 | $5,460 | $0 |
| 2022 | $199 | $5,460 | $5,460 | $0 |
| 2021 | $228 | $5,450 | $5,450 | $0 |
| 2020 | $228 | $5,450 | $5,450 | $0 |
| 2019 | $223 | $5,450 | $5,450 | $0 |
| 2018 | $212 | $4,740 | $4,740 | $0 |
| 2017 | $212 | $4,740 | $4,740 | $0 |
| 2016 | $225 | $4,740 | $4,740 | $0 |
| 2015 | $213 | $4,740 | $4,740 | $0 |
| 2014 | $434 | $4,740 | $4,740 | $0 |
| 2012 | $216 | $4,740 | $4,740 | $0 |
Source: Public Records
Map
Nearby Homes