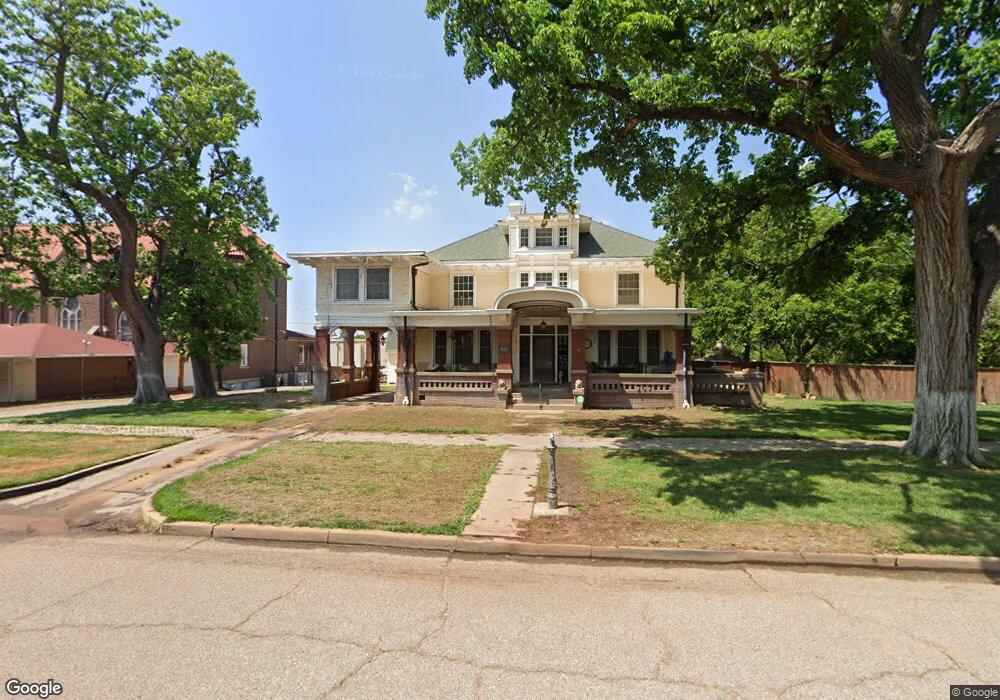
417 N Elm St Guthrie, OK 73044
Estimated Value: $226,000 - $335,000
4
Beds
2
Baths
520
Sq Ft
$559/Sq Ft
Est. Value
About This Home
This home is located at 417 N Elm St, Guthrie, OK 73044 and is currently estimated at $290,817, approximately $559 per square foot. 417 N Elm St is a home located in Logan County with nearby schools including Central Elementary School, Fogarty Elementary School, and Cotteral Elementary School.
Ownership History
Date
Name
Owned For
Owner Type
Purchase Details
Closed on
Jun 7, 2022
Sold by
Russell Douglas S and Russell Jennifer
Bought by
Nelson Mbm Investments Llc
Current Estimated Value
Purchase Details
Closed on
Sep 30, 2021
Sold by
Ayers Raymond Thomas and Ayers Julie C
Bought by
Russell Douglas and Russell Jennifer
Home Financials for this Owner
Home Financials are based on the most recent Mortgage that was taken out on this home.
Original Mortgage
$270,750
Interest Rate
2.8%
Mortgage Type
New Conventional
Purchase Details
Closed on
May 9, 2005
Sold by
Gonzalez Jose A and Gonzalez Perlacita S
Bought by
Ayers Raymond Thomas and Ayers Julie C Burgess
Home Financials for this Owner
Home Financials are based on the most recent Mortgage that was taken out on this home.
Original Mortgage
$135,000
Interest Rate
5.92%
Mortgage Type
New Conventional
Create a Home Valuation Report for This Property
The Home Valuation Report is an in-depth analysis detailing your home's value as well as a comparison with similar homes in the area
Home Values in the Area
Average Home Value in this Area
Purchase History
| Date | Buyer | Sale Price | Title Company |
|---|---|---|---|
| Nelson Mbm Investments Llc | $80,000 | Neat Escrow And Title | |
| Russell Douglas | $285,000 | Chicago Title Oklahoma Co | |
| Ayers Raymond Thomas | $131,000 | Lawyers Title Of Oklahoma Ci |
Source: Public Records
Mortgage History
| Date | Status | Borrower | Loan Amount |
|---|---|---|---|
| Previous Owner | Russell Douglas | $270,750 | |
| Previous Owner | Ayers Raymond Thomas | $135,000 |
Source: Public Records
Tax History Compared to Growth
Tax History
| Year | Tax Paid | Tax Assessment Tax Assessment Total Assessment is a certain percentage of the fair market value that is determined by local assessors to be the total taxable value of land and additions on the property. | Land | Improvement |
|---|---|---|---|---|
| 2025 | $3,065 | $33,021 | $2,264 | $30,757 |
| 2024 | $2,926 | $32,060 | $2,264 | $29,796 |
| 2023 | $2,926 | $31,126 | $2,264 | $28,862 |
| 2022 | $2,692 | $30,219 | $2,264 | $27,955 |
| 2021 | $2,348 | $26,329 | $2,225 | $24,104 |
| 2020 | $2,281 | $25,562 | $2,149 | $23,413 |
| 2019 | $2,248 | $24,817 | $2,115 | $22,702 |
| 2018 | $2,119 | $24,094 | $2,087 | $22,007 |
| 2017 | $2,021 | $23,393 | $2,060 | $21,333 |
| 2016 | $1,981 | $22,712 | $2,039 | $20,673 |
| 2014 | $1,545 | $21,252 | $1,452 | $19,800 |
| 2013 | -- | $23,184 | $1,584 | $21,600 |
Source: Public Records
Map
Nearby Homes
- 624 E Mansur Ave
- 624 E Noble Ave
- 322 E Warner Ave
- 611 E Noble Ave
- 407 E Washington Ave
- 415 N Broad St
- 609 E College Ave
- 611 N Broad St
- 621 N Wentz St
- 708 E Harrison Ave
- 1005 E Noble Ave
- 515 E Harrison Ave
- 1016 E Noble Ave
- 105 E College Ave
- 805 E Harrison Ave
- 124 W Noble Ave
- 708 E Vilas Ave
- 514 N 1st St
- 911 Rosebrier Ct
- 403 E Vilas Ave
- 509 E Mansur Ave
- 601 E Mansur Ave
- 501 E Mansur Ave
- 411 N Elm St
- 520 E Mansur Ave
- 512 E Mansur Ave
- 604 E Warner Ave
- 602 E Mansur Ave
- 608 E Warner Ave
- 613 E Mansur Ave
- 606 E Mansur Ave
- 614 E Warner Ave
- 612 E Mansur Ave
- 523 E Warner Ave
- 617 E Mansur Ave
- 521 E Logan Ave
- 424 E Mansur Ave
- 515 E Logan Ave
- 509 E Logan Ave
- 507 E Warner Ave