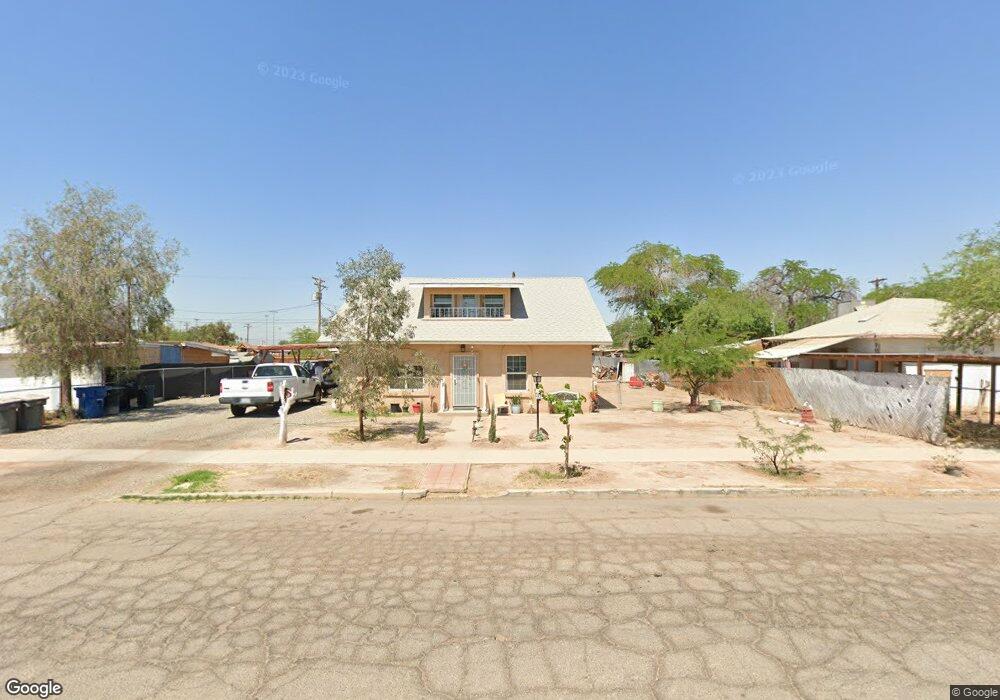
417 N F St Unit 417 1/2 Imperial, CA 92251
Estimated Value: $287,934 - $391,000
--
Bed
--
Bath
1,564
Sq Ft
$226/Sq Ft
Est. Value
About This Home
This home is located at 417 N F St Unit 417 1/2, Imperial, CA 92251 and is currently estimated at $353,234, approximately $225 per square foot. 417 N F St Unit 417 1/2 is a home located in Imperial County with nearby schools including Ben Hulse Elementary School, Frank M. Wright Middle School, and Imperial Avenue Holbrook High School.
Ownership History
Date
Name
Owned For
Owner Type
Purchase Details
Closed on
Jul 19, 2023
Sold by
Encinas Eduardo and Encinas Ana Georgina
Bought by
Encinas Trust and Encinas
Current Estimated Value
Purchase Details
Closed on
Jul 13, 2004
Sold by
Encinas Georgina Andrade
Bought by
Encinas Edward and Encinas Georgina Andrade
Home Financials for this Owner
Home Financials are based on the most recent Mortgage that was taken out on this home.
Original Mortgage
$97,100
Interest Rate
5.97%
Mortgage Type
Stand Alone Refi Refinance Of Original Loan
Create a Home Valuation Report for This Property
The Home Valuation Report is an in-depth analysis detailing your home's value as well as a comparison with similar homes in the area
Home Values in the Area
Average Home Value in this Area
Purchase History
| Date | Buyer | Sale Price | Title Company |
|---|---|---|---|
| Encinas Trust | -- | None Listed On Document | |
| Encinas Edward | -- | Chicago Title Co |
Source: Public Records
Mortgage History
| Date | Status | Borrower | Loan Amount |
|---|---|---|---|
| Previous Owner | Encinas Edward | $97,100 |
Source: Public Records
Tax History Compared to Growth
Tax History
| Year | Tax Paid | Tax Assessment Tax Assessment Total Assessment is a certain percentage of the fair market value that is determined by local assessors to be the total taxable value of land and additions on the property. | Land | Improvement |
|---|---|---|---|---|
| 2025 | $1,220 | $111,505 | $64,415 | $47,090 |
| 2023 | $1,220 | $107,176 | $61,914 | $45,262 |
| 2022 | $1,195 | $105,075 | $60,700 | $44,375 |
| 2021 | $1,177 | $103,015 | $59,510 | $43,505 |
| 2020 | $1,165 | $101,959 | $58,900 | $43,059 |
| 2019 | $1,149 | $99,961 | $57,746 | $42,215 |
| 2018 | $1,134 | $98,002 | $56,614 | $41,388 |
| 2017 | $1,068 | $96,081 | $55,504 | $40,577 |
| 2016 | $1,029 | $94,198 | $54,416 | $39,782 |
| 2015 | -- | $92,784 | $53,599 | $39,185 |
| 2014 | -- | $90,968 | $52,550 | $38,418 |
Source: Public Records
Map
Nearby Homes