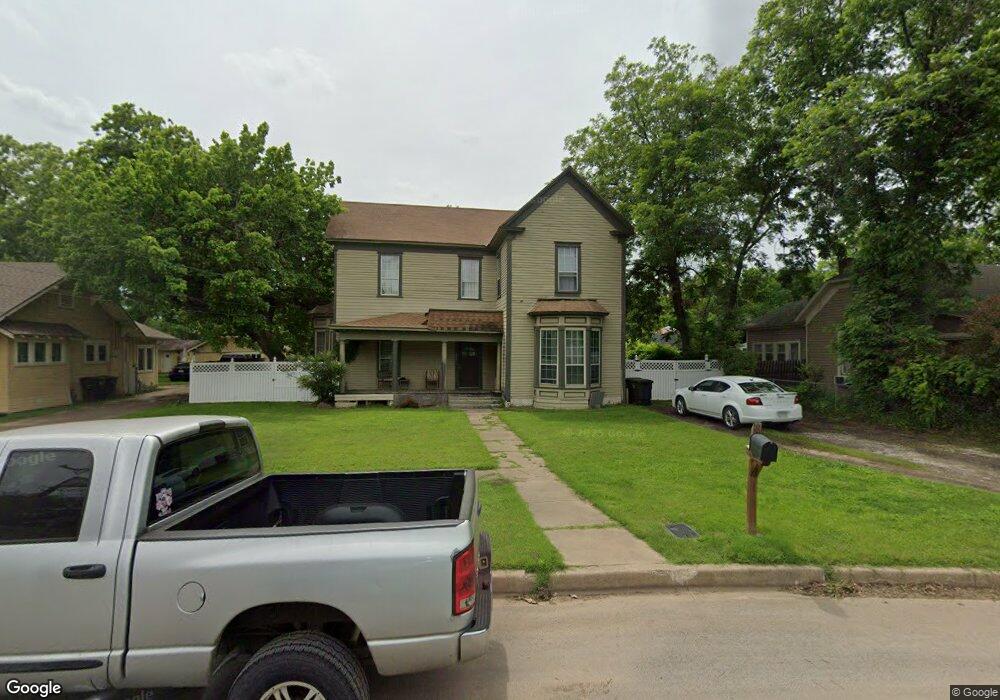
417 N Wilhite St Cleburne, TX 76031
Estimated Value: $215,000 - $270,000
4
Beds
3
Baths
2,176
Sq Ft
$115/Sq Ft
Est. Value
About This Home
This home is located at 417 N Wilhite St, Cleburne, TX 76031 and is currently estimated at $251,297, approximately $115 per square foot. 417 N Wilhite St is a home located in Johnson County with nearby schools including Santa Fe Elementary School, Lowell Smith Jr. Middle School, and Cleburne High School.
Ownership History
Date
Name
Owned For
Owner Type
Purchase Details
Closed on
Aug 16, 2017
Sold by
Sepulveda Keith and Sepulveda Stephanie
Bought by
Olson Victoria Lorraine
Current Estimated Value
Home Financials for this Owner
Home Financials are based on the most recent Mortgage that was taken out on this home.
Original Mortgage
$98,325
Outstanding Balance
$82,045
Interest Rate
3.96%
Mortgage Type
New Conventional
Estimated Equity
$169,252
Purchase Details
Closed on
May 2, 2008
Sold by
Whitehead Farris D and Whitehead Loretta S
Bought by
Sepulveda Keith and Sepulveda Stephanie
Home Financials for this Owner
Home Financials are based on the most recent Mortgage that was taken out on this home.
Original Mortgage
$90,000
Interest Rate
5.86%
Mortgage Type
Purchase Money Mortgage
Create a Home Valuation Report for This Property
The Home Valuation Report is an in-depth analysis detailing your home's value as well as a comparison with similar homes in the area
Home Values in the Area
Average Home Value in this Area
Purchase History
| Date | Buyer | Sale Price | Title Company |
|---|---|---|---|
| Olson Victoria Lorraine | -- | Stewart Title | |
| Sepulveda Keith | -- | Fatco |
Source: Public Records
Mortgage History
| Date | Status | Borrower | Loan Amount |
|---|---|---|---|
| Open | Olson Victoria Lorraine | $98,325 | |
| Previous Owner | Sepulveda Keith | $90,000 |
Source: Public Records
Tax History Compared to Growth
Tax History
| Year | Tax Paid | Tax Assessment Tax Assessment Total Assessment is a certain percentage of the fair market value that is determined by local assessors to be the total taxable value of land and additions on the property. | Land | Improvement |
|---|---|---|---|---|
| 2025 | $5,267 | $236,207 | $23,500 | $212,707 |
| 2024 | $5,267 | $236,207 | $23,500 | $212,707 |
| 2023 | $5,256 | $236,207 | $23,500 | $212,707 |
| 2022 | $5,911 | $236,207 | $23,500 | $212,707 |
| 2021 | $6,163 | $236,207 | $23,500 | $212,707 |
| 2020 | $3,710 | $133,888 | $20,000 | $113,888 |
| 2019 | $3,956 | $133,888 | $20,000 | $113,888 |
| 2018 | $2,973 | $100,563 | $16,500 | $84,063 |
| 2017 | $2,784 | $94,563 | $10,500 | $84,063 |
| 2016 | $2,784 | $94,563 | $10,500 | $84,063 |
| 2015 | $2,562 | $94,563 | $10,500 | $84,063 |
| 2014 | $2,562 | $96,094 | $10,500 | $85,594 |
Source: Public Records
Map
Nearby Homes
- 407 N Wilhite St
- 612 N Robinson St
- 614 N Robinson St
- 603 N Anglin St
- 204 Robbins St
- 709 N Wilhite St Unit 711
- 731 E Brown St
- 1033 Spring Azure Dr
- 8225 Farm To Market 1434
- 507 N Buffalo Ave
- 709 N Buffalo Ave
- 220 W Wardville St
- 735 N Robinson St
- 741 N Robinson St
- 216 W Willingham St
- 312 N Wood St
- 605 Olive St
- 107 Mcarthur Ln
- 1308 N Brazos Ave
- 702 N Walnut St
- 415 N Wilhite St
- 419 N Wilhite St
- 411 N Wilhite St
- 421 N Wilhite St
- 409 N Wilhite St
- 101 Locust St
- 423 N Wilhite St
- 425 N Wilhite St
- 414 N Wilhite St
- 422 N Wilhite St
- 103 Locust St
- 410 N Anglin St
- 424 N Wilhite St
- 412 N Wilhite St
- 427 N Wilhite St
- 105 Locust St
- 406 Whitenack St
- 405 N Wilhite St
- 506 N Anglin St
- 506 N Anglin St