
Seller's Agent in 2026
Jennifer Branson
Idaho Country Properties
(208) 791-6315
58 Total Sales


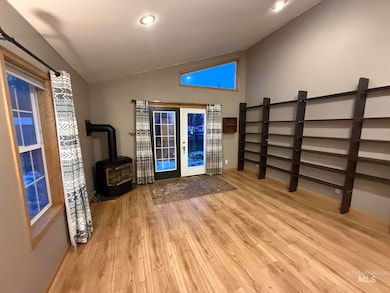

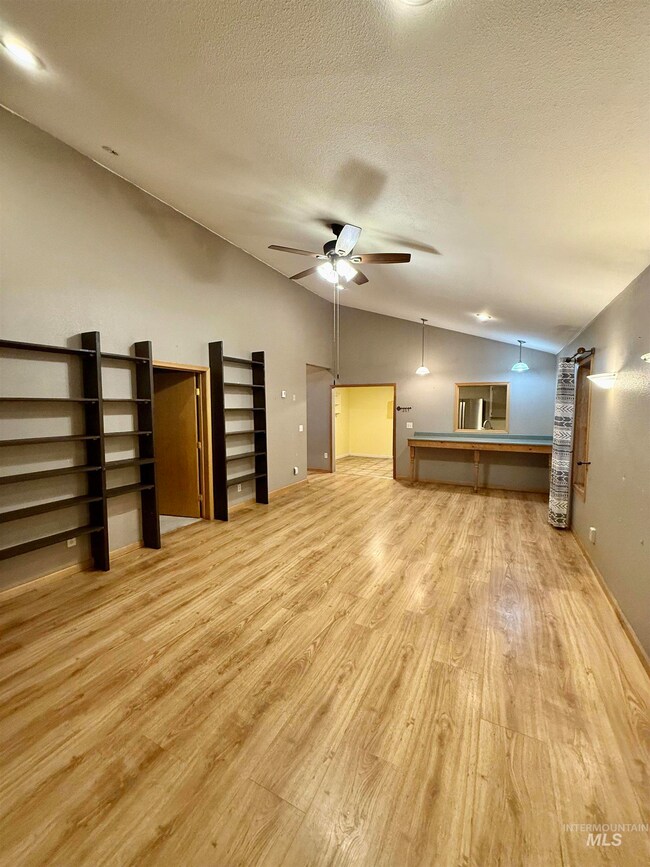
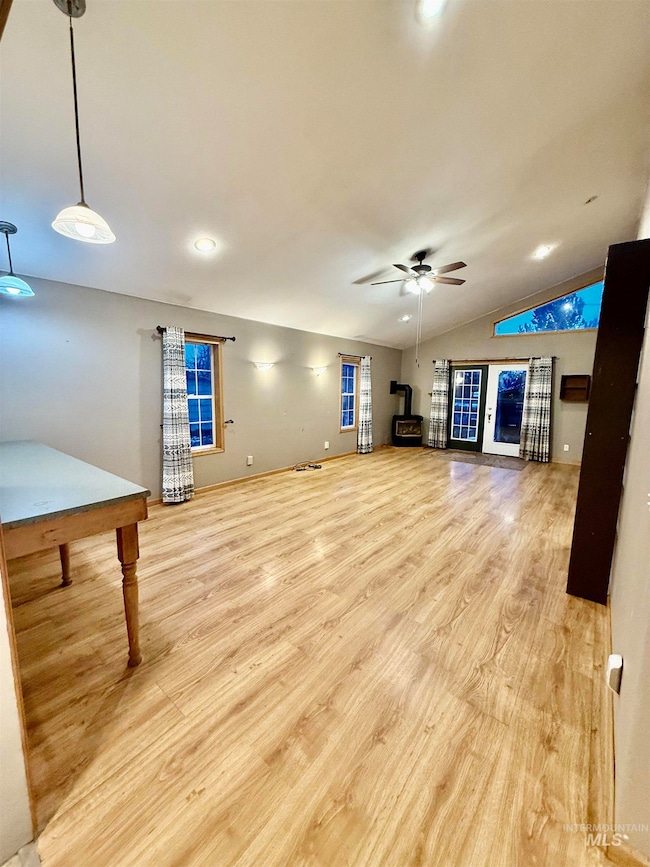
Welcome to easy living in the heart of Nezperce, Idaho—where quiet streets, friendly neighbors, and small-town charm come together. This inviting 4 bed, 2 bath single-level home offers the perfect blend of comfort and convenience, whether you're a first-time homebuyer or looking to downsize without compromise. Step inside to a bright, functional layout designed for everyday living. The spacious living area flows effortlessly into the kitchen and dining spaces, making it easy to entertain, unwind, or simply enjoy the peaceful pace of life Nezperce is known for. Four bedrooms provide flexibility for guests, hobbies, or a home office, while two full bathrooms add practical comfort for the whole household. Outside, you’ll appreciate the generous yard—ideal for gardening, play, or a quiet evening under Idaho’s wide-open skies. And the location couldn’t be better: just a short stroll to Lions Park, the Pre-K through 12 school, and all the essential amenities this warm, welcoming community has to offer. A great opportunity for someone ready to add their personal touch and bring out the full potential of this charming home! If you’re looking for a home that feels grounded, easy, and connected, this charming Nezperce property is ready to welcome you home.
Last Agent to Sell the Property
Idaho Country Properties Brokerage Phone: 208-926-0075 Listed on: 12/05/2025
Last Buyer's Agent
Idaho Country Properties Brokerage Phone: 208-926-0075 Listed on: 12/05/2025
We collect this data history from publicly available records. To have your information removed, we recommend requesting removal directly through your county’s website.
We collect this data history from publicly available records. To have your information removed, we recommend requesting removal directly through your county’s website.
| Date | Type | Sale Price | Title Company |
|---|---|---|---|
| Warranty Deed | -- | -- | |
| Warranty Deed | -- | -- |
We collect this data history from publicly available records. To have your information removed, we recommend requesting removal directly through your county’s website.
| Date | Status | Loan Amount | Loan Type |
|---|---|---|---|
| Closed | $71,500 | Unknown | |
| Previous Owner | $74,569 | VA |
We collect this data history from publicly available records. To have your information removed, we recommend requesting removal directly through your county’s website.
| Date | Event | Price | List to Sale | Price per Sq Ft |
|---|---|---|---|---|
| 04/22/2026 04/22/26 | Sold | -- | -- | -- |
| 02/27/2026 02/27/26 | Pending | -- | -- | -- |
| 02/24/2026 02/24/26 | Price Changed | $237,000 | -0.8% | $109 / Sq Ft |
| 12/05/2025 12/05/25 | For Sale | $239,000 | -- | $110 / Sq Ft |
We collect this data history from publicly available records. To have your information removed, we recommend requesting removal directly through your county’s website.
| Year | Tax Paid | Tax Assessment Tax Assessment Total Assessment is a certain percentage of the fair market value that is determined by local assessors to be the total taxable value of land and additions on the property. | Land | Improvement |
|---|---|---|---|---|
| 2025 | $1,627 | $193,592 | $16,538 | $177,054 |
| 2024 | $1,567 | $187,013 | $16,538 | $170,475 |
| 2023 | $1,567 | $239,851 | $16,538 | $223,313 |
| 2022 | $2,086 | $223,178 | $16,538 | $206,640 |
| 2021 | $1,979 | $191,295 | $11,643 | $179,652 |
| 2020 | $1,623 | $139,097 | $11,643 | $127,454 |
| 2019 | $1,610 | $135,032 | $11,643 | $123,389 |
| 2018 | $1,569 | $135,032 | $11,643 | $123,389 |
| 2017 | $1,555 | $136,689 | $11,643 | $125,046 |
| 2015 | $1,389 | $119,111 | $10,601 | $108,510 |
| 2011 | -- | $100,724 | $6,804 | $93,920 |
Seller's Agent in 2026
Jennifer Branson
Idaho Country Properties
(208) 791-6315
58 Total Sales
Source: Intermountain MLS
MLS Number: 98969197
APN: RPN0340025015A
Disclaimer: Certain information contained herein is derived from information provided by parties other than Homes.com. All information provided is deemed reliable, but is not guaranteed to be accurate and should be independently verified.
![]() IDX information is provided exclusively for consumers’ personal, non-commercial use, that it may not be used for any purpose other than to identify prospective properties consumers may be interested in purchasing. IMLS does not assume any liability for missing or inaccurate data.
IDX information is provided exclusively for consumers’ personal, non-commercial use, that it may not be used for any purpose other than to identify prospective properties consumers may be interested in purchasing. IMLS does not assume any liability for missing or inaccurate data.
Information provided by IMLS is deemed reliable but not guaranteed.
Ask me questions while you tour the home.