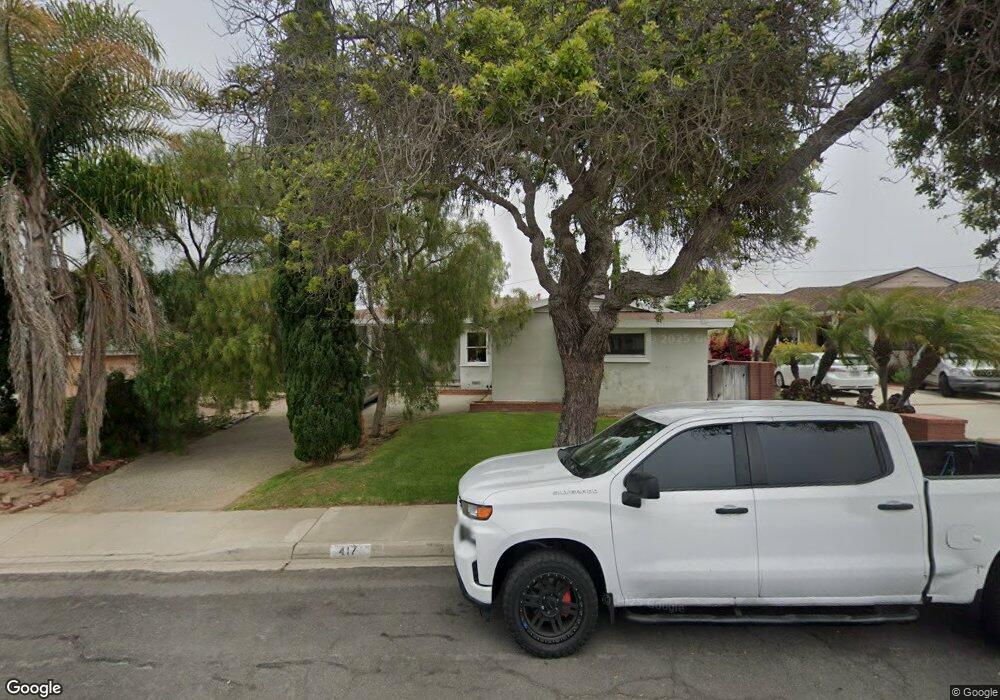
417 Via Anita Redondo Beach, CA 90277
Riviera NeighborhoodEstimated Value: $1,957,000 - $3,221,000
4
Beds
2
Baths
1,503
Sq Ft
$1,554/Sq Ft
Est. Value
About This Home
This home is located at 417 Via Anita, Redondo Beach, CA 90277 and is currently estimated at $2,336,295, approximately $1,554 per square foot. 417 Via Anita is a home located in Los Angeles County with nearby schools including Riviera Elementary School, Edward J. Richardson Middle School, and South High School.
Ownership History
Date
Name
Owned For
Owner Type
Purchase Details
Closed on
Jul 20, 2005
Sold by
George Suzanne Adams and Markolita Dyess Adams Revocabl
Bought by
Legare Steven R
Current Estimated Value
Home Financials for this Owner
Home Financials are based on the most recent Mortgage that was taken out on this home.
Original Mortgage
$661,200
Interest Rate
1%
Mortgage Type
Fannie Mae Freddie Mac
Purchase Details
Closed on
Oct 10, 2001
Sold by
Mir Jehan
Bought by
Mir Rukhsana
Home Financials for this Owner
Home Financials are based on the most recent Mortgage that was taken out on this home.
Original Mortgage
$125,000
Interest Rate
10%
Purchase Details
Closed on
May 10, 1999
Sold by
Mir Jehan Z and Mir Jehan
Bought by
Mir Jehan and The Jehan Mir Living Trust
Create a Home Valuation Report for This Property
The Home Valuation Report is an in-depth analysis detailing your home's value as well as a comparison with similar homes in the area
Home Values in the Area
Average Home Value in this Area
Purchase History
| Date | Buyer | Sale Price | Title Company |
|---|---|---|---|
| Legare Steven R | $826,500 | -- | |
| Mir Rukhsana | $425,000 | South Coast Title Company | |
| Mir Jehan | -- | -- |
Source: Public Records
Mortgage History
| Date | Status | Borrower | Loan Amount |
|---|---|---|---|
| Previous Owner | Legare Steven R | $661,200 | |
| Previous Owner | Mir Rukhsana | $125,000 |
Source: Public Records
Tax History Compared to Growth
Tax History
| Year | Tax Paid | Tax Assessment Tax Assessment Total Assessment is a certain percentage of the fair market value that is determined by local assessors to be the total taxable value of land and additions on the property. | Land | Improvement |
|---|---|---|---|---|
| 2025 | $7,153 | $627,827 | $502,270 | $125,557 |
| 2024 | $7,153 | $615,518 | $492,422 | $123,096 |
| 2023 | $7,026 | $603,450 | $482,767 | $120,683 |
| 2022 | $6,935 | $591,618 | $473,301 | $118,317 |
| 2021 | $5,585 | $465,227 | $464,021 | $1,206 |
| 2019 | $5,427 | $451,430 | $450,259 | $1,171 |
| 2018 | $5,225 | $442,580 | $441,431 | $1,149 |
| 2016 | $4,962 | $425,396 | $424,291 | $1,105 |
| 2015 | $4,856 | $419,007 | $417,918 | $1,089 |
| 2014 | $4,737 | $410,800 | $409,732 | $1,068 |
Source: Public Records
Map
Nearby Homes
- 417 Via la Soledad
- 411 Via Mesa Grande
- 2737 Via la Selva
- 438 Calle de Aragon
- 426 Via la Selva
- 111 Calle Mayor
- 2709
- 320 Calle Mayor
- 204 Via Colusa
- 424 Camino de Encanto
- 237 Via Los Miradores
- 445 Calle Mayor
- 433 Paseo de la Playa
- 639 Paseo de la Playa Unit 107
- 649 Paseo de la Playa Unit 303
- 163 Paseo de la Concha Unit 4
- 163 Paseo de la Concha Unit 1
- 544 Calle Mayor
- 3321 Via la Selva
- 3225 Paseo Del Campo
- 413 Via Anita
- 421 Via Anita
- 218 Via Pasqual
- 425 Via Anita
- 409 Via Anita
- 214 Via Pasqual
- 222 Via Pasqual
- 210 Via Pasqual
- 400 Via la Soledad
- 405 Via la Soledad
- 429 Via Anita
- 206 Via Pasqual
- 226 Via Pasqual
- 405 Via Anita
- 404 Via la Soledad
- 145 Via Alameda
- 202 Via Pasqual
- 230 Via Pasqual
- 139 Via Alameda
- 433 Via Anita