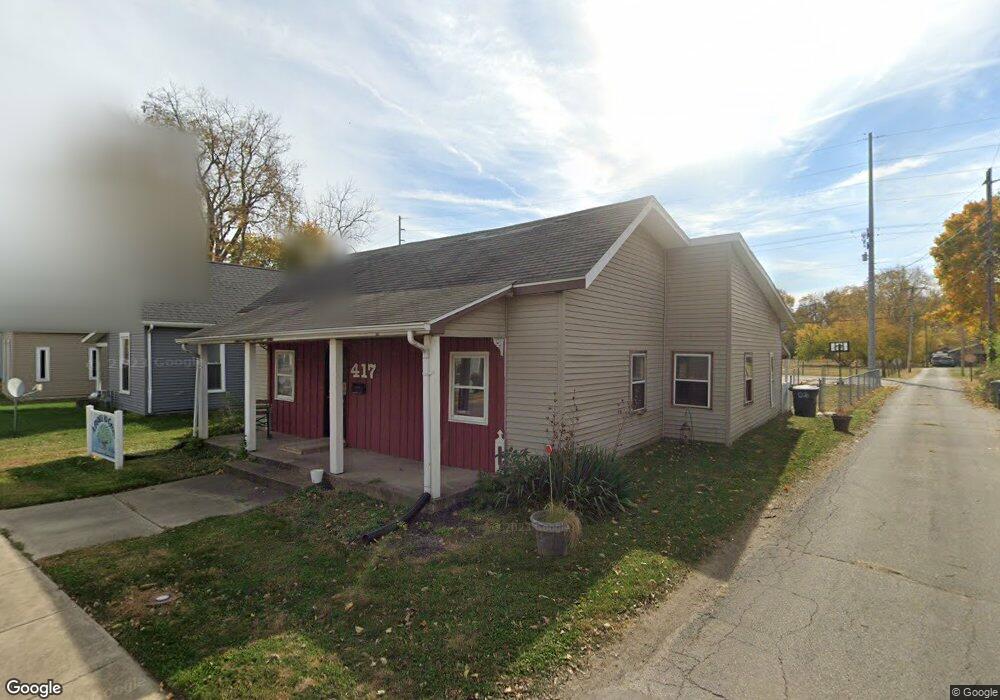
417 W 1st St Rushville, IN 46173
Estimated Value: $122,000 - $160,029
3
Beds
2
Baths
1,749
Sq Ft
$84/Sq Ft
Est. Value
About This Home
This home is located at 417 W 1st St, Rushville, IN 46173 and is currently estimated at $147,257, approximately $84 per square foot. 417 W 1st St is a home located in Rush County with nearby schools including Rushville Consolidated High School and St. Mary Catholic School.
Ownership History
Date
Name
Owned For
Owner Type
Purchase Details
Closed on
Feb 6, 2018
Sold by
Secretary Of Housing And Urban Develomet
Bought by
Wesling Geoffrey W and Wesling Jessica A
Current Estimated Value
Purchase Details
Closed on
Oct 1, 2013
Sold by
Citimortgage Inc
Bought by
Secretary Of Housing And Urban Developme
Purchase Details
Closed on
May 21, 2013
Sold by
Secretary Of H U D
Bought by
Citimortgage Inc
Purchase Details
Closed on
Jul 12, 2012
Sold by
Citimortgage Inc
Bought by
Secretary Of Hud
Purchase Details
Closed on
Jun 28, 2012
Sold by
Rogers Elizabeth A
Bought by
Citimortgage Inc
Create a Home Valuation Report for This Property
The Home Valuation Report is an in-depth analysis detailing your home's value as well as a comparison with similar homes in the area
Home Values in the Area
Average Home Value in this Area
Purchase History
| Date | Buyer | Sale Price | Title Company |
|---|---|---|---|
| Wesling Geoffrey W | -- | None Available | |
| Secretary Of Housing And Urban Developme | -- | None Available | |
| Citimortgage Inc | -- | None Available | |
| Secretary Of Hud | -- | None Available | |
| Citimortgage Inc | -- | None Available |
Source: Public Records
Tax History Compared to Growth
Tax History
| Year | Tax Paid | Tax Assessment Tax Assessment Total Assessment is a certain percentage of the fair market value that is determined by local assessors to be the total taxable value of land and additions on the property. | Land | Improvement |
|---|---|---|---|---|
| 2024 | $2,006 | $100,300 | $14,900 | $85,400 |
| 2023 | $1,878 | $93,900 | $14,900 | $79,000 |
| 2022 | $1,750 | $87,500 | $14,900 | $72,600 |
| 2021 | $1,160 | $57,700 | $14,900 | $42,800 |
| 2020 | $1,096 | $54,500 | $14,000 | $40,500 |
| 2019 | $1,052 | $52,300 | $14,000 | $38,300 |
| 2018 | $930 | $46,200 | $8,200 | $38,000 |
| 2017 | $936 | $46,500 | $8,200 | $38,300 |
| 2016 | $912 | $45,300 | $8,200 | $37,100 |
| 2014 | $1,268 | $63,100 | $8,200 | $54,900 |
| 2013 | $1,268 | $63,100 | $8,200 | $54,900 |
Source: Public Records
Map
Nearby Homes