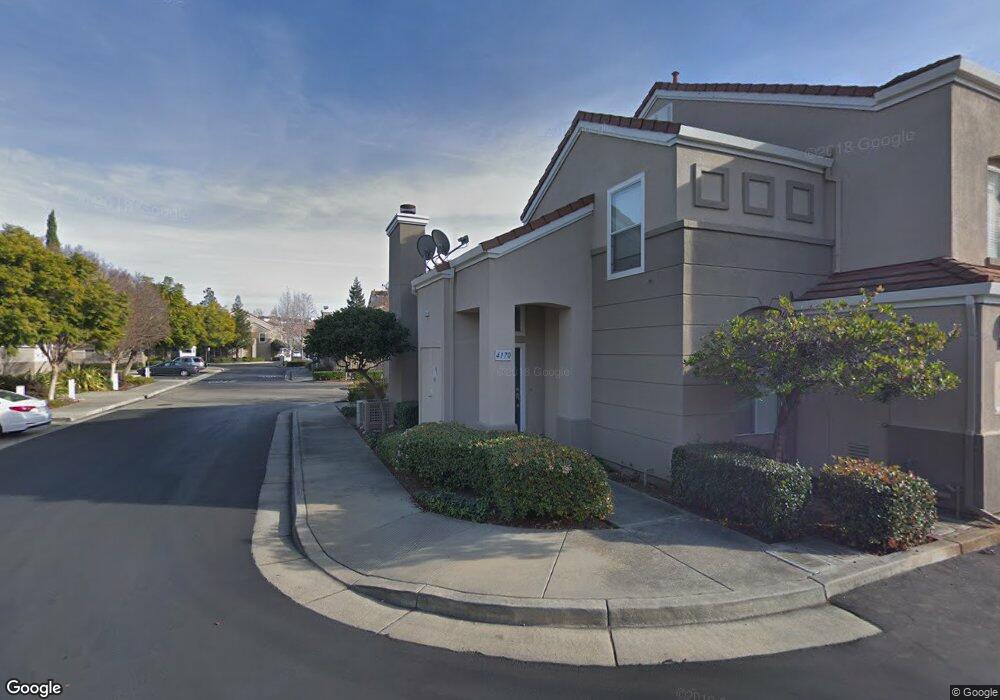
4170 Sophia Way Unit 1 San Jose, CA 95134
North San Jose NeighborhoodEstimated Value: $997,000 - $1,245,000
3
Beds
3
Baths
1,325
Sq Ft
$852/Sq Ft
Est. Value
About This Home
This home is located at 4170 Sophia Way Unit 1, San Jose, CA 95134 and is currently estimated at $1,128,915, approximately $852 per square foot. 4170 Sophia Way Unit 1 is a home located in Santa Clara County with nearby schools including Don Callejon School, George Mayne Elementary School, and Adrian Wilcox High School.
Ownership History
Date
Name
Owned For
Owner Type
Purchase Details
Closed on
Oct 24, 2020
Sold by
Tseng Peter K and Tseng Nicole
Bought by
Tseng Peter and Tseng Nicole
Current Estimated Value
Purchase Details
Closed on
Nov 29, 2005
Sold by
Tseng Peter K
Bought by
Tseng Peter K and Tseng Nicole
Purchase Details
Closed on
Apr 12, 2002
Sold by
Hsu Jane
Bought by
Tseng Peter K
Home Financials for this Owner
Home Financials are based on the most recent Mortgage that was taken out on this home.
Original Mortgage
$300,700
Outstanding Balance
$120,730
Interest Rate
6.37%
Estimated Equity
$1,008,185
Purchase Details
Closed on
May 18, 1999
Sold by
Djakovic Vladan and Djakovic Savic Nada
Bought by
Hsu Jane
Home Financials for this Owner
Home Financials are based on the most recent Mortgage that was taken out on this home.
Original Mortgage
$225,400
Interest Rate
6.75%
Create a Home Valuation Report for This Property
The Home Valuation Report is an in-depth analysis detailing your home's value as well as a comparison with similar homes in the area
Home Values in the Area
Average Home Value in this Area
Purchase History
| Date | Buyer | Sale Price | Title Company |
|---|---|---|---|
| Tseng Peter | -- | None Available | |
| Tseng Peter K | -- | -- | |
| Tseng Peter K | $420,000 | Financial Title Company | |
| Hsu Jane | $322,000 | Financial Title Company |
Source: Public Records
Mortgage History
| Date | Status | Borrower | Loan Amount |
|---|---|---|---|
| Open | Tseng Peter K | $300,700 | |
| Previous Owner | Hsu Jane | $225,400 | |
| Closed | Tseng Peter K | $35,300 |
Source: Public Records
Tax History Compared to Growth
Tax History
| Year | Tax Paid | Tax Assessment Tax Assessment Total Assessment is a certain percentage of the fair market value that is determined by local assessors to be the total taxable value of land and additions on the property. | Land | Improvement |
|---|---|---|---|---|
| 2025 | $7,767 | $620,445 | $236,355 | $384,090 |
| 2024 | $7,767 | $608,280 | $231,721 | $376,559 |
| 2023 | $7,661 | $596,354 | $227,178 | $369,176 |
| 2022 | $7,559 | $584,662 | $222,724 | $361,938 |
| 2021 | $7,589 | $573,199 | $218,357 | $354,842 |
| 2020 | $7,356 | $567,323 | $216,119 | $351,204 |
| 2019 | $7,357 | $556,200 | $211,882 | $344,318 |
| 2018 | $6,872 | $545,295 | $207,728 | $337,567 |
| 2017 | $6,835 | $534,604 | $203,655 | $330,949 |
| 2016 | $6,706 | $524,122 | $199,662 | $324,460 |
| 2015 | $6,663 | $516,250 | $196,663 | $319,587 |
| 2014 | $6,326 | $506,138 | $192,811 | $313,327 |
Source: Public Records
Map
Nearby Homes
- 4098 Biscotti Place Unit 199
- 418 Pinefield Rd Unit 418
- 425 Shorewood Ln
- 4271 N First St Unit 124
- 316 Los Encinos St
- 316 Los Encinos St Unit 316
- 626 Hermitage St Unit 626
- 269 El Bosque Dr
- 2052 Gold St Unit 234
- 108 El Bosque Dr Unit 108
- 584 Hermitage Dr
- 673 Hermitage Place Unit 673
- 708 Spindrift Dr Unit 708
- 777 Spindrift Place Unit 777
- 1391 State St
- 1883 Agnew Rd Unit 367
- 2200 Agnew Rd Unit 207
- 2200 Agnew Rd Unit 118
- 3901 Lick Mill Blvd Unit 358
- 3901 Lick Mill Blvd Unit 312
- 4172 Sophia Way Unit 2
- 4182 Sophia Way Unit 7
- 4174 Sophia Way
- 4176 Sophia Way
- 4184 Sophia Way
- 4178 Sophia Way
- 93 Mirabelli Cir
- 91 Mirabelli Cir Unit 40
- 4180 Sophia Way
- 4137 Boneso Cir Unit 13
- 96 Mirabelli Cir
- 89 Mirabelli Cir
- 4139 Boneso Cir Unit 12
- 95 Mirabelli Cir
- 4135 Boneso Cir Unit 14
- 4186 Sophia Way Unit 74
- 4198 Sophia Way Unit 80
- 94 Mirabelli Cir Unit 43
- 4141 Boneso Cir
- 4143 Boneso Cir Unit 10