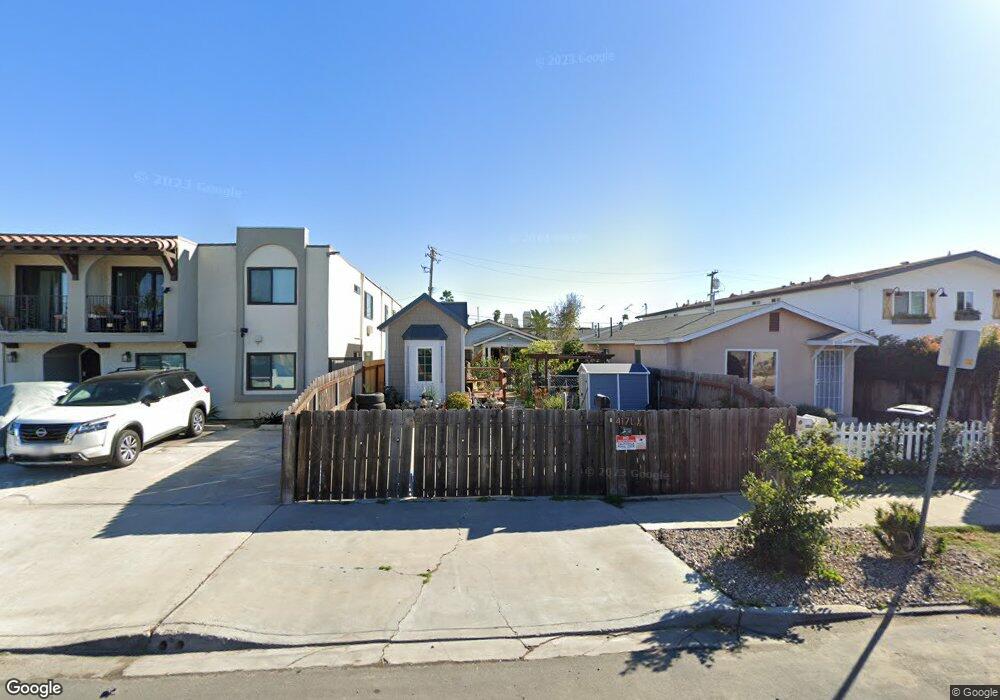
4171 1/2 36th St San Diego, CA 92104
Corridor NeighborhoodEstimated Value: $710,727 - $923,000
2
Beds
1
Bath
666
Sq Ft
$1,188/Sq Ft
Est. Value
About This Home
This home is located at 4171 1/2 36th St, San Diego, CA 92104 and is currently estimated at $791,432, approximately $1,188 per square foot. 4171 1/2 36th St is a home located in San Diego County with nearby schools including Edison Elementary School, Wilson Middle School, and Herbert Hoover High School.
Ownership History
Date
Name
Owned For
Owner Type
Purchase Details
Closed on
Mar 8, 2012
Sold by
Penton Cheryl Rae
Bought by
Penton Cheryl Rae
Current Estimated Value
Home Financials for this Owner
Home Financials are based on the most recent Mortgage that was taken out on this home.
Original Mortgage
$239,000
Outstanding Balance
$163,941
Interest Rate
3.84%
Mortgage Type
New Conventional
Estimated Equity
$627,491
Purchase Details
Closed on
Jan 31, 2001
Sold by
Escobar Edgar A and Escobar Argelia M
Bought by
Penton Cheryl Rae
Home Financials for this Owner
Home Financials are based on the most recent Mortgage that was taken out on this home.
Original Mortgage
$136,000
Interest Rate
7.11%
Purchase Details
Closed on
Oct 7, 1991
Purchase Details
Closed on
Aug 3, 1990
Create a Home Valuation Report for This Property
The Home Valuation Report is an in-depth analysis detailing your home's value as well as a comparison with similar homes in the area
Home Values in the Area
Average Home Value in this Area
Purchase History
| Date | Buyer | Sale Price | Title Company |
|---|---|---|---|
| Penton Cheryl Rae | -- | First American Title Company | |
| Penton Cheryl Rae | $170,000 | Fidelity National Title Co | |
| -- | $85,000 | -- | |
| -- | $65,000 | -- |
Source: Public Records
Mortgage History
| Date | Status | Borrower | Loan Amount |
|---|---|---|---|
| Open | Penton Cheryl Rae | $239,000 | |
| Closed | Penton Cheryl Rae | $136,000 |
Source: Public Records
Tax History Compared to Growth
Tax History
| Year | Tax Paid | Tax Assessment Tax Assessment Total Assessment is a certain percentage of the fair market value that is determined by local assessors to be the total taxable value of land and additions on the property. | Land | Improvement |
|---|---|---|---|---|
| 2025 | $3,033 | $256,135 | $195,880 | $60,255 |
| 2024 | $3,033 | $251,114 | $192,040 | $59,074 |
| 2023 | $2,964 | $246,191 | $188,275 | $57,916 |
| 2022 | $2,884 | $241,365 | $184,584 | $56,781 |
| 2021 | $2,862 | $236,633 | $180,965 | $55,668 |
| 2020 | $2,827 | $234,208 | $179,110 | $55,098 |
| 2019 | $2,775 | $229,617 | $175,599 | $54,018 |
| 2018 | $2,594 | $225,115 | $172,156 | $52,959 |
| 2017 | $2,531 | $220,702 | $168,781 | $51,921 |
| 2016 | $2,488 | $216,375 | $165,472 | $50,903 |
| 2015 | $2,451 | $213,126 | $162,987 | $50,139 |
| 2014 | $2,411 | $208,952 | $159,795 | $49,157 |
Source: Public Records
Map
Nearby Homes
- 4164 Cherokee Ave Unit G
- 4153 Wilson Ave
- 4102 Cherokee Ave
- 4164 38th St
- 4252 35th St Unit 6
- 4053 Wilson Ave
- 4332 Wilson Ave
- 4358-64 36th St
- 4041 38th St
- 3890 37th St
- 4233 39th St Unit C
- 4342 39th St
- 4411 Mcclintock St
- 4150 34th St Unit 7
- 4150 34th St Unit 8
- 3864 35th St
- 3846 38th St Unit 5
- 3846 38th St Unit 3
- 3812-14 36th St
- 3535 Monroe Ave Unit 51
- 4169 36th St Unit 71
- 4173 36th St
- 4149 36th St Unit 63
- 4145 36th St
- 4123 36th St
- 3627 Orange Ave
- 4164 Cherokee Ave Unit F
- 4164 Cherokee Ave Unit C
- 4164 Cherokee Ave Unit B
- 4164 Cherokee Ave Unit A
- 4164 Cherokee Ave Unit E
- 4172 Cherokee Ave Unit 76
- 4154 Cherokee Ave
- 4156 Cherokee Ave
- 4156 Cherokee Ave Unit 58
- 3637 Orange Ave
- 4178 Cherokee Ave Unit 80
- 4150 Cherokee Ave
- 4188 36th St
- 4135 36th St Unit 37