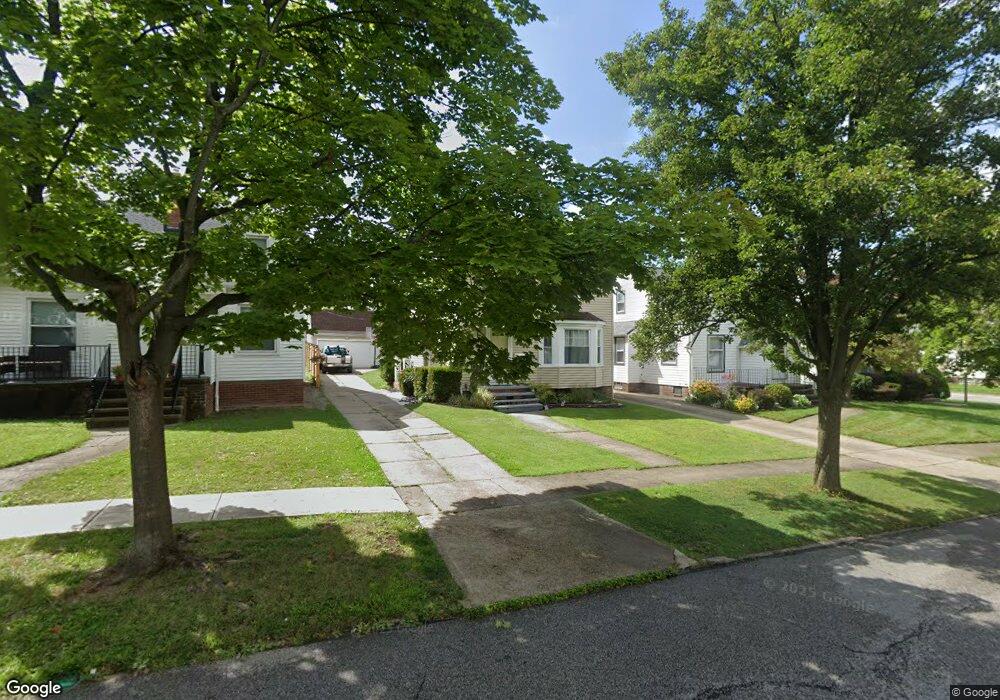
4172 W 48th St Cleveland, OH 44144
Old Brooklyn NeighborhoodEstimated Value: $144,721 - $167,000
2
Beds
2
Baths
1,139
Sq Ft
$136/Sq Ft
Est. Value
About This Home
This home is located at 4172 W 48th St, Cleveland, OH 44144 and is currently estimated at $154,680, approximately $135 per square foot. 4172 W 48th St is a home located in Cuyahoga County with nearby schools including Benjamin Franklin, Almira Academy, and Artemus Ward School.
Ownership History
Date
Name
Owned For
Owner Type
Purchase Details
Closed on
May 26, 2010
Sold by
Vukmire Linda
Bought by
Ramos Luis J and Despiau Yadira
Current Estimated Value
Home Financials for this Owner
Home Financials are based on the most recent Mortgage that was taken out on this home.
Original Mortgage
$71,038
Outstanding Balance
$48,259
Interest Rate
5.25%
Mortgage Type
FHA
Estimated Equity
$106,421
Purchase Details
Closed on
Jan 13, 1992
Sold by
Huskey Richard A
Bought by
Vukmire Linda
Purchase Details
Closed on
May 9, 1988
Sold by
Belknap Wallace
Bought by
Huskey Richard A
Purchase Details
Closed on
Mar 28, 1985
Sold by
Belknap Wallace
Bought by
Belknap Wallace
Purchase Details
Closed on
Aug 15, 1979
Sold by
Brutosky Rene
Bought by
Belknap Wallace
Purchase Details
Closed on
Jul 2, 1976
Sold by
Rasor Carl V
Bought by
Brutosky Rene
Purchase Details
Closed on
Jan 1, 1975
Bought by
Rasor Carl and Rasor Jennette
Create a Home Valuation Report for This Property
The Home Valuation Report is an in-depth analysis detailing your home's value as well as a comparison with similar homes in the area
Home Values in the Area
Average Home Value in this Area
Purchase History
| Date | Buyer | Sale Price | Title Company |
|---|---|---|---|
| Ramos Luis J | $72,000 | City Title Agency | |
| Vukmire Linda | $57,900 | -- | |
| Huskey Richard A | $48,000 | -- | |
| Belknap Wallace | -- | -- | |
| Belknap Wallace | $48,000 | -- | |
| Brutosky Rene | $16,000 | -- | |
| Rasor Carl | $16,000 | -- | |
| Rasor Carl | -- | -- |
Source: Public Records
Mortgage History
| Date | Status | Borrower | Loan Amount |
|---|---|---|---|
| Open | Ramos Luis J | $71,038 |
Source: Public Records
Tax History Compared to Growth
Tax History
| Year | Tax Paid | Tax Assessment Tax Assessment Total Assessment is a certain percentage of the fair market value that is determined by local assessors to be the total taxable value of land and additions on the property. | Land | Improvement |
|---|---|---|---|---|
| 2024 | $2,909 | $43,505 | $8,995 | $34,510 |
| 2023 | $2,206 | $28,460 | $6,090 | $22,370 |
| 2022 | $2,194 | $28,460 | $6,090 | $22,370 |
| 2021 | $2,173 | $28,460 | $6,090 | $22,370 |
| 2020 | $1,949 | $22,050 | $4,730 | $17,330 |
| 2019 | $1,805 | $63,000 | $13,500 | $49,500 |
| 2018 | $1,799 | $22,050 | $4,730 | $17,330 |
| 2017 | $1,791 | $21,180 | $4,030 | $17,150 |
| 2016 | $1,777 | $21,180 | $4,030 | $17,150 |
| 2015 | $1,981 | $21,180 | $4,030 | $17,150 |
| 2014 | $1,981 | $23,520 | $4,480 | $19,040 |
Source: Public Records
Map
Nearby Homes
- 4185 W 50th St
- 4140 W 49th St
- 4109 W 50th St
- 4215 W 58th St
- 4373 W 52nd St
- 4098 W 57th St
- 3923 Pensacola Ave
- 4102 Spokane Ave
- 4427 W 49th St
- 3909 Memphis Ave
- 4456 W 49th St
- 3810 Memphis Ave
- 3821 Spokane Ave
- 4811 Ardmore Ave
- 4615 Ardmore Ave
- 3532 Muriel Ave
- 4484 W 53rd St
- 4329 Ardmore Ave
- 3529 Broadview Rd
- 3613 Henritze Ave