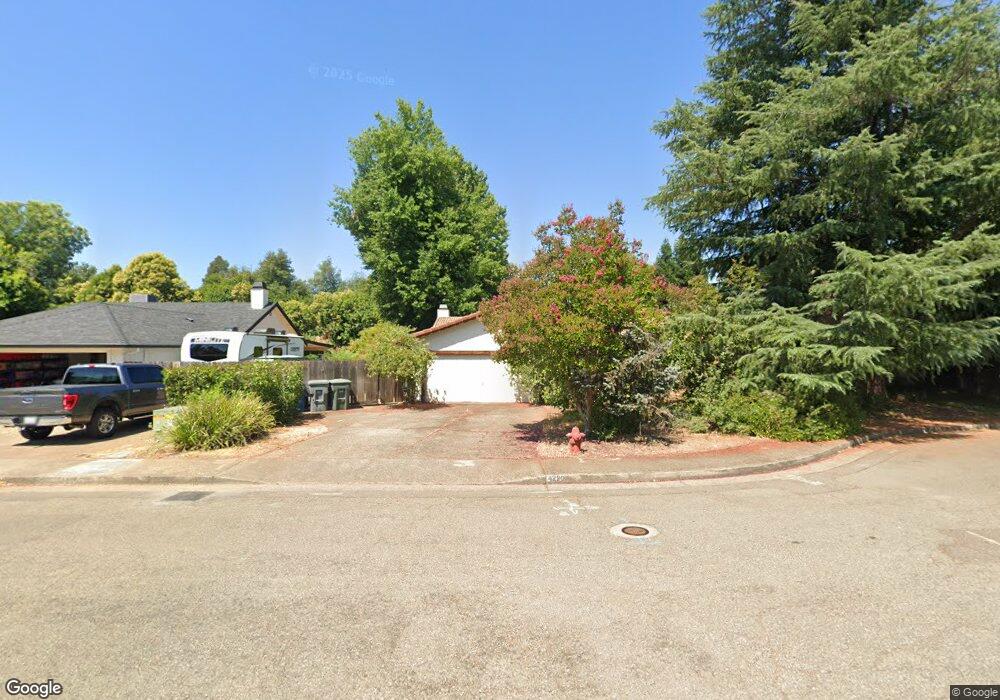
4175 Bechelli Ln Redding, CA 96002
South Bechelli NeighborhoodEstimated Value: $264,032 - $368,000
3
Beds
2
Baths
1,232
Sq Ft
$256/Sq Ft
Est. Value
About This Home
This home is located at 4175 Bechelli Ln, Redding, CA 96002 and is currently estimated at $315,258, approximately $255 per square foot. 4175 Bechelli Ln is a home located in Shasta County with nearby schools including Lassen View Elementary School, Parsons Junior High School, and Enterprise High School.
Create a Home Valuation Report for This Property
The Home Valuation Report is an in-depth analysis detailing your home's value as well as a comparison with similar homes in the area
Home Values in the Area
Average Home Value in this Area
Tax History
| Year | Tax Paid | Tax Assessment Tax Assessment Total Assessment is a certain percentage of the fair market value that is determined by local assessors to be the total taxable value of land and additions on the property. | Land | Improvement |
|---|---|---|---|---|
| 2025 | $717 | $70,180 | $8,973 | $61,207 |
| 2024 | $705 | $68,805 | $8,798 | $60,007 |
| 2023 | $705 | $67,457 | $8,626 | $58,831 |
| 2022 | $684 | $66,135 | $8,457 | $57,678 |
| 2021 | $659 | $64,840 | $8,292 | $56,548 |
| 2020 | $655 | $64,176 | $8,207 | $55,969 |
| 2019 | $648 | $62,919 | $8,047 | $54,872 |
| 2018 | $638 | $61,687 | $7,890 | $53,797 |
| 2017 | $647 | $60,479 | $7,736 | $52,743 |
| 2016 | $605 | $59,294 | $7,585 | $51,709 |
| 2015 | $583 | $58,405 | $7,472 | $50,933 |
| 2014 | $577 | $57,262 | $7,326 | $49,936 |
Source: Public Records
Map
Nearby Homes
- 607 Woodacre Dr
- 751 Woodacre Dr
- 3708 Traverse St
- 3689 Suzanne Way
- 688 Julie Way
- 4020 Churn Creek Rd
- 737 Estate St
- 4323 Churn Crk Rd
- 5367 Rosswood Ln
- 3857 Eagle Pkwy
- 5443 Rosswood St
- 3540 Ricardo Ave
- 3500 Pioneer Ln
- 3527 Adams Ln
- 3232 Nicolet Ln
- 1108 4th St
- 4302 Paulson Ln
- 1354 Harpole Rd
- 3759 Alma Ave
- 0 Lot4 Unit 2 Ph 2 Stillwater Unit 25-4962
- 4181 Bechelli Ln
- 4165 Bechelli Ln
- 4169 Bechelli Ln
- 4220 Pasatiempo Ct
- 4232 Pasatiempo Ct
- 4208 Pasatiempo Ct
- 4171 Bechelli Ln
- 4205 Bechelli Ln
- 4163 Bechelli Ln
- 4191 Bechelli Ln
- 4244 Pasatiempo Ct
- 4201 Bechelli Ln
- 547 Rafael St
- 569 Rafael St
- 4256 Pasatiempo Ct Unit CLEAN
- 4256 Pasatiempo Ct
- 4133 Bechelli Ln
- 4200 Pasatiempo Ct
- 4221 Bechelli Ln
- 4213 Bechelli Ln
Your Personal Tour Guide
Ask me questions while you tour the home.