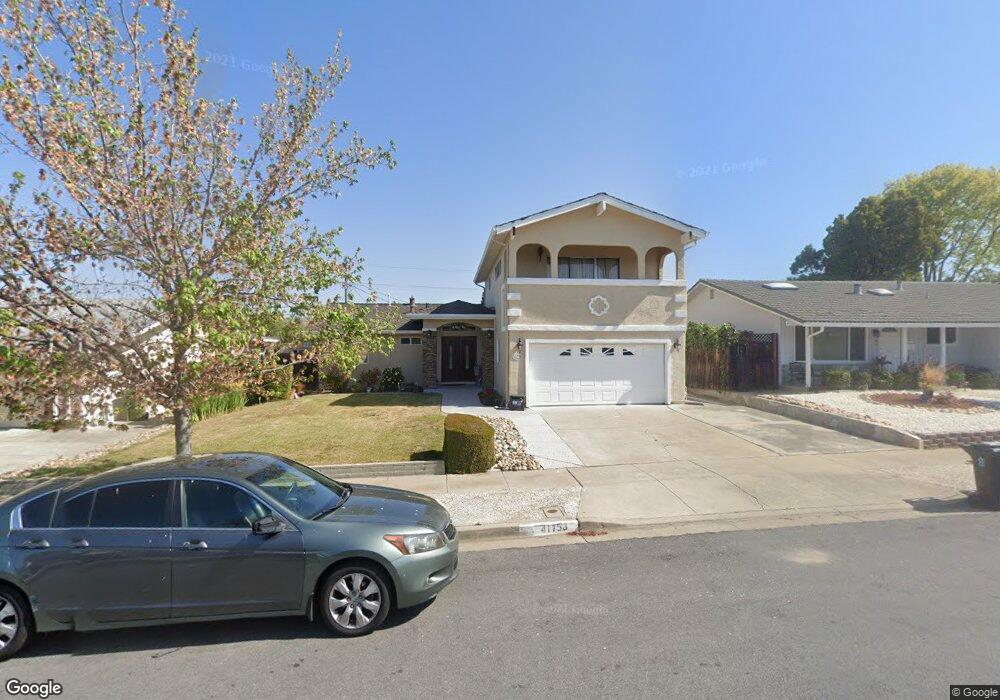
41758 Higgins Way Fremont, CA 94539
Mission Valley NeighborhoodEstimated Value: $2,197,959 - $2,481,000
4
Beds
3
Baths
2,134
Sq Ft
$1,103/Sq Ft
Est. Value
About This Home
This home is located at 41758 Higgins Way, Fremont, CA 94539 and is currently estimated at $2,353,990, approximately $1,103 per square foot. 41758 Higgins Way is a home located in Alameda County with nearby schools including Mission Valley Elementary School, William Hopkins Junior High School, and Mission San Jose High School.
Ownership History
Date
Name
Owned For
Owner Type
Purchase Details
Closed on
Aug 18, 2020
Sold by
Pareenja Ramesh and Pareenja Ercilia V
Bought by
Pareenja Ramesh and Pareenja Ercilia V
Current Estimated Value
Create a Home Valuation Report for This Property
The Home Valuation Report is an in-depth analysis detailing your home's value as well as a comparison with similar homes in the area
Home Values in the Area
Average Home Value in this Area
Purchase History
| Date | Buyer | Sale Price | Title Company |
|---|---|---|---|
| Pareenja Ramesh | -- | None Available |
Source: Public Records
Tax History Compared to Growth
Tax History
| Year | Tax Paid | Tax Assessment Tax Assessment Total Assessment is a certain percentage of the fair market value that is determined by local assessors to be the total taxable value of land and additions on the property. | Land | Improvement |
|---|---|---|---|---|
| 2025 | $4,499 | $330,760 | $97,167 | $240,593 |
| 2024 | $4,499 | $324,138 | $95,262 | $235,876 |
| 2023 | $4,364 | $324,646 | $93,394 | $231,252 |
| 2022 | $4,287 | $311,282 | $91,563 | $226,719 |
| 2021 | $4,186 | $305,041 | $89,768 | $222,273 |
| 2020 | $4,133 | $308,843 | $88,848 | $219,995 |
| 2019 | $3,873 | $284,388 | $87,106 | $197,282 |
| 2018 | $3,361 | $241,792 | $85,398 | $156,394 |
| 2017 | $3,140 | $225,287 | $83,724 | $141,563 |
| 2016 | $3,074 | $220,870 | $82,082 | $138,788 |
| 2015 | $3,021 | $217,554 | $80,850 | $136,704 |
| 2014 | $2,960 | $213,294 | $79,267 | $134,027 |
Source: Public Records
Map
Nearby Homes
- 1224 Bedford St
- 2225 Valorie St
- 41519 Apricot Ln
- 1873 Berry Ct
- 1123 Farragut Dr
- 42329 Troyer Ave
- 41082 Joyce Ave
- 1962 Briscoe Terrace
- 41620 Beatrice St
- 41043 Joyce Ave
- 2785 Washington Blvd
- 41538 Casabella Common
- 2851 Finca Terrace
- 41246 Mission Blvd
- 41997 Via San Gabriel
- 41252 Mission Blvd
- 40743 Rainwater Ct Unit 80
- 3331 Union St
- 2164 Ocaso Camino
- 905 Glenhill Dr
- 41744 Higgins Way
- 41770 Higgins Way
- 41757 Paseo Padre Pkwy
- 41769 Paseo Padre Pkwy
- 41732 Higgins Way
- 41784 Higgins Way
- 41745 Paseo Padre Pkwy
- 41781 Paseo Padre Pkwy
- 41759 Higgins Way
- 41745 Higgins Way
- 41771 Higgins Way
- 41733 Paseo Padre Pkwy
- 41818 Higgins Way
- 41720 Higgins Way
- 41793 Paseo Padre Pkwy
- 41733 Higgins Way
- 41785 Higgins Way
- 41721 Paseo Padre Pkwy
- 41721 Higgins Way
- 41826 Higgins Way