
Seller's Agent in 2018
Albert Le
LE INVESTMENT GROUP
(909) 256-7889
24 Total Sales
Competitive Offering Actual CAP Rate of 4.15 % With a Pro Forma CAP Rate of 5.23 % / ProForma CAP Rate is Achievable Through Continued Market Rental Increases. In Addition The Current Owner Is Not Charging For Available Garage Space / Competitive Offering GRM of 14.17 With a
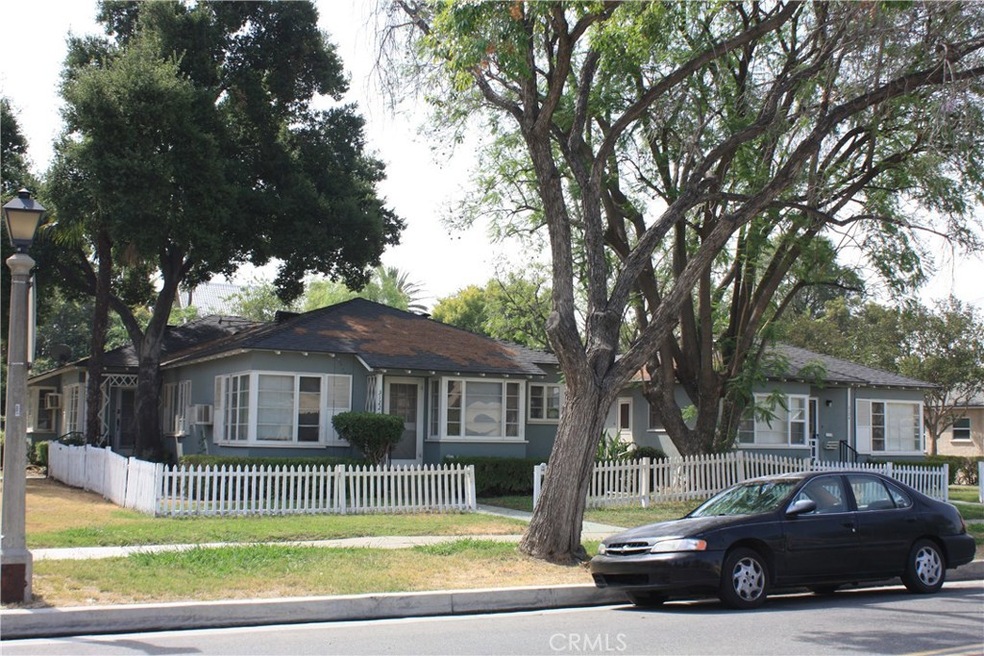
Pro Forma GRM of 12.94 / 1st Time to The Market in 16+ Years. Pride of Ownership Property. / Huge Upside In Potential Rental Income. Conservative 7-10 % Upside in Potential Rental Income Per Rental Survey / / Rental Comparables Illustrate a 100 % Occupancy Area / Located in a Quiet Residential Neighborhood. Non-Rent Control Located Block From Riverside Community College. The properties consist of two lots that are adjacent to each other. This eight unit apartment property is composed of 5 one bedroom / one bathroom units, 2 two bedroom / one bathroom units and 1 two bedroom / one bathroom single family home. The property is located in the historic Downtown Riverside sub market and is only a 10 minute walk away from the beautiful Fairmount Park. The immediate area consists mainly of single family residences with smaller apartment complexes. Home and apartment vacancy rates are very low at 3-7%, and most of the tenants of the subject property are long-term tenants who have lived there since the 1990s. Analysis shows that this rate is lower than 48.7% of the neighborhoods in the nation, approximately near the middle range for vacancies.
We collect this data history from publicly available records. To have your information removed, we recommend requesting removal directly through your county’s website.
| Date | Event | Price | List to Sale | Price per Sq Ft |
|---|---|---|---|---|
| 09/04/2018 09/04/18 | Sold | $1,150,000 | -8.0% | $193 / Sq Ft |
| 08/08/2018 08/08/18 | For Sale | $1,250,000 | -- | $210 / Sq Ft |
We collect this data history from publicly available records. To have your information removed, we recommend requesting removal directly through your county’s website.
| Year | Tax Paid | Tax Assessment Tax Assessment Total Assessment is a certain percentage of the fair market value that is determined by local assessors to be the total taxable value of land and additions on the property. | Land | Improvement |
|---|---|---|---|---|
| 2025 | $5,820 | $529,867 | $195,213 | $334,654 |
| 2023 | $5,820 | $509,294 | $187,634 | $321,660 |
| 2022 | $5,689 | $499,308 | $183,955 | $315,353 |
| 2021 | $5,613 | $489,519 | $180,349 | $309,170 |
| 2020 | $5,571 | $484,500 | $178,500 | $306,000 |
| 2019 | $5,467 | $475,000 | $175,000 | $300,000 |
| 2018 | $2,847 | $245,635 | $127,127 | $118,508 |
| 2017 | $2,797 | $240,820 | $124,635 | $116,185 |
| 2016 | $2,620 | $236,099 | $122,192 | $113,907 |
| 2015 | $2,582 | $232,554 | $120,357 | $112,197 |
| 2014 | $2,556 | $228,000 | $118,000 | $110,000 |
Seller's Agent in 2018
Albert Le
LE INVESTMENT GROUP
(909) 256-7889
24 Total Sales
Source: California Regional Multiple Listing Service (CRMLS)
MLS Number: IV18192731
APN: 214-042-001
Disclaimer: Certain information contained herein is derived from information provided by parties other than Homes.com. All information provided is deemed reliable, but is not guaranteed to be accurate and should be independently verified.
![]() The multiple listing data appearing on this website, or contained in reports produced therefrom, is owned and copyrighted by California Regional Multiple Listing Service, Inc. ("CRMLS") and is protected by all applicable copyright laws. Information provided is for viewer's personal, non-commercial use and may not be used for any purpose other than to identify prospective properties the viewer may be interested in purchasing. All listing data, including but not limited to square footage and lot size is believed to be accurate, but the listing Agent, listing Broker and CRMLS and its affiliates do not warrant or guarantee such accuracy. The viewer should independently verify the listed data prior to making any decisions based on such information by personal inspection and/or contacting a real estate professional.
The multiple listing data appearing on this website, or contained in reports produced therefrom, is owned and copyrighted by California Regional Multiple Listing Service, Inc. ("CRMLS") and is protected by all applicable copyright laws. Information provided is for viewer's personal, non-commercial use and may not be used for any purpose other than to identify prospective properties the viewer may be interested in purchasing. All listing data, including but not limited to square footage and lot size is believed to be accurate, but the listing Agent, listing Broker and CRMLS and its affiliates do not warrant or guarantee such accuracy. The viewer should independently verify the listed data prior to making any decisions based on such information by personal inspection and/or contacting a real estate professional.
Based on information from California Regional Multiple Listing Service, Inc. and /or other sources. All data, including all measurements and calculations of area, is obtained from various sources and has not been, and will not be, verified by broker or MLS. All information should be independently reviewed and verified for accuracy. Properties may or may not be listed by the office/agent presenting the information
Ask me questions while you tour the home.