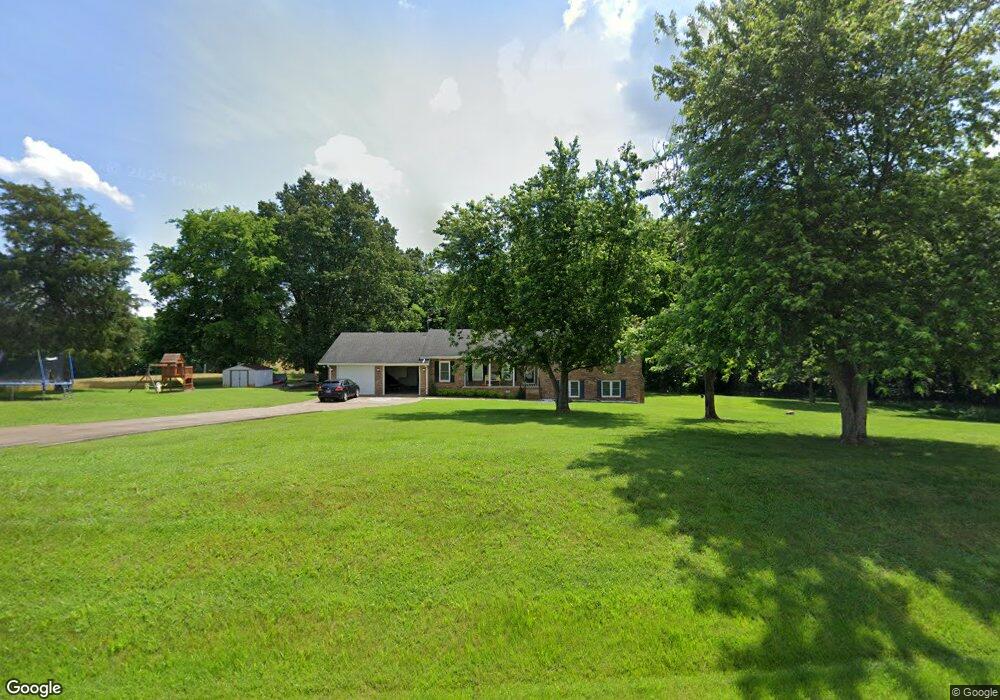
4178 N Grace Roach Rd South Fulton, TN 38257
Estimated Value: $299,000 - $355,000
--
Bed
3
Baths
2,694
Sq Ft
$117/Sq Ft
Est. Value
About This Home
This home is located at 4178 N Grace Roach Rd, South Fulton, TN 38257 and is currently estimated at $316,427, approximately $117 per square foot. 4178 N Grace Roach Rd is a home located in Obion County.
Ownership History
Date
Name
Owned For
Owner Type
Purchase Details
Closed on
Oct 1, 2024
Sold by
Morris William C and Morris Emily
Bought by
Wright Steven Dale and Wright Brandy Leigh
Current Estimated Value
Home Financials for this Owner
Home Financials are based on the most recent Mortgage that was taken out on this home.
Original Mortgage
$248,000
Outstanding Balance
$245,461
Interest Rate
6.49%
Mortgage Type
New Conventional
Estimated Equity
$70,966
Purchase Details
Closed on
Jul 12, 2017
Sold by
Roach Keith A
Bought by
Morris William C and Morris Emily
Home Financials for this Owner
Home Financials are based on the most recent Mortgage that was taken out on this home.
Original Mortgage
$154,715
Interest Rate
3.91%
Mortgage Type
New Conventional
Purchase Details
Closed on
Jun 7, 2016
Sold by
Tripp Helen B
Bought by
Roach Keith A and Roach Deborah A
Purchase Details
Closed on
Dec 31, 1981
Bought by
Tripp Sidney H and Tripp Helen
Purchase Details
Closed on
Jan 1, 1981
Purchase Details
Closed on
Jan 1, 1980
Create a Home Valuation Report for This Property
The Home Valuation Report is an in-depth analysis detailing your home's value as well as a comparison with similar homes in the area
Home Values in the Area
Average Home Value in this Area
Purchase History
| Date | Buyer | Sale Price | Title Company |
|---|---|---|---|
| Wright Steven Dale | $310,000 | None Listed On Document | |
| Morris William C | $159,500 | -- | |
| Roach Keith A | $60,000 | -- | |
| Tripp Sidney H | -- | -- | |
| -- | $63,000 | -- | |
| -- | $56,000 | -- |
Source: Public Records
Mortgage History
| Date | Status | Borrower | Loan Amount |
|---|---|---|---|
| Open | Wright Steven Dale | $248,000 | |
| Previous Owner | Morris William C | $154,715 |
Source: Public Records
Tax History Compared to Growth
Tax History
| Year | Tax Paid | Tax Assessment Tax Assessment Total Assessment is a certain percentage of the fair market value that is determined by local assessors to be the total taxable value of land and additions on the property. | Land | Improvement |
|---|---|---|---|---|
| 2024 | $850 | $61,550 | $1,750 | $59,800 |
| 2023 | $850 | $61,550 | $1,750 | $59,800 |
| 2022 | $696 | $36,650 | $2,125 | $34,525 |
| 2021 | $696 | $36,650 | $2,125 | $34,525 |
| 2020 | $696 | $36,650 | $2,125 | $34,525 |
| 2019 | $696 | $36,650 | $2,125 | $34,525 |
| 2018 | $698 | $36,650 | $2,125 | $34,525 |
| 2017 | $604 | $30,125 | $1,925 | $28,200 |
| 2016 | $604 | $30,125 | $1,925 | $28,200 |
| 2015 | $604 | $30,125 | $1,925 | $28,200 |
| 2014 | $604 | $30,125 | $1,925 | $28,200 |
Source: Public Records
Map
Nearby Homes
- 5024 Old Pierce Rd
- 4988 Milltown Rd
- 508 Vancil St
- 507 Vancil St
- 216 Old Pierce Rd
- 210 Old Pierce Rd
- 811 Key St
- 413 Honey Locust Dr
- 1633 Spruce Ave
- 709 Tennessee St
- 1743 Beechwood St
- 109 West St
- 1015 W 4th St
- 1008 W 4th St
- 104 Park Ave Unit F
- 608 Green St
- 1109 W 5th St
- 310 2nd St Unit F
- 204 Park St
- 304 Eddings St
- 4143 N Grace Roach Rd
- 4100 N Grace Roach Rd
- 4053 N Grace Roach Rd
- 4160 Smith Cardwell Rd
- 7995 E Pierce Station Rd
- 7786 E Pierce Station Rd
- 7947 E Pierce Station Rd
- 3985 N Grace Roach Rd
- 7973 E Pierce Station Rd
- 4151 Smith Cardwell Rd
- 8005 E Pierce Station Rd
- 7964 E Pierce Station Rd
- 7986 E Pierce Station Rd
- 8067 E Pierce Station Rd
- 4137 John Ferguson Rd
- 4199 John Ferguson Rd
- 4255 John Ferguson Rd
- 4319 Smith Cardwell Rd
- 8041 E Pierce Station Rd
- 3920 N Grace Roach Rd