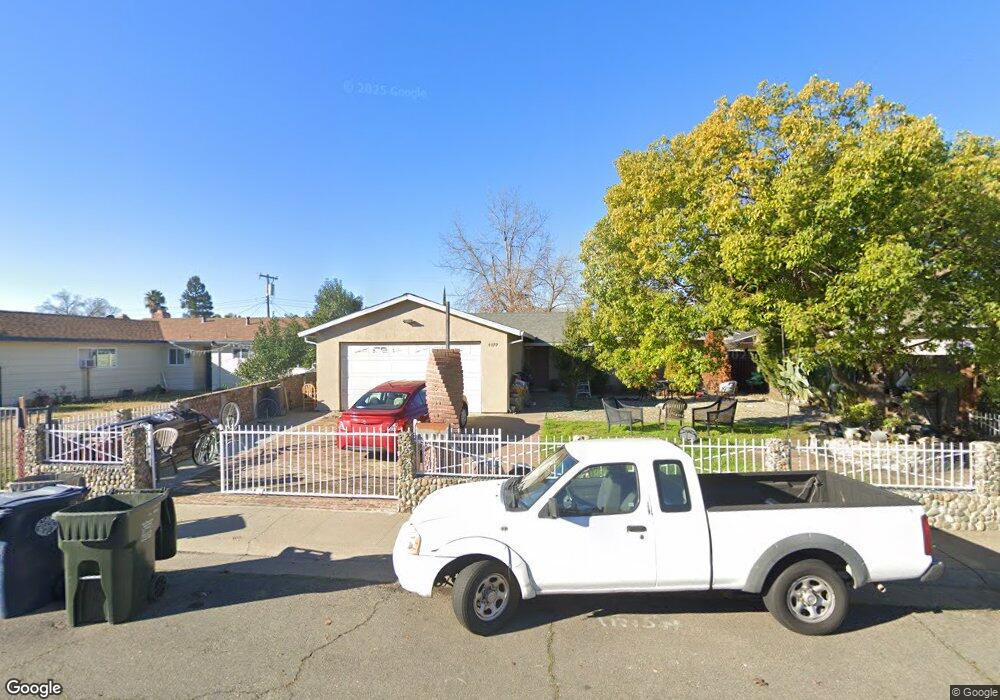
4179 Fruita Ct Sacramento, CA 95838
Glenwood Meadows NeighborhoodEstimated Value: $245,000 - $424,000
3
Beds
2
Baths
1,104
Sq Ft
$329/Sq Ft
Est. Value
About This Home
This home is located at 4179 Fruita Ct, Sacramento, CA 95838 and is currently estimated at $362,750, approximately $328 per square foot. 4179 Fruita Ct is a home located in Sacramento County with nearby schools including Glenwood Elementary School, Rio Linda Preparatory Academy, and Norwood Junior High School.
Ownership History
Date
Name
Owned For
Owner Type
Purchase Details
Closed on
Sep 12, 2007
Sold by
Pardo Pedro Guzman
Bought by
Gonzalez Pardo Pedro Guzman and Gonzalez Torres Ana Lilia
Current Estimated Value
Purchase Details
Closed on
Mar 10, 2003
Sold by
Torres Ana Gonzales
Bought by
Pardo Pedro Guzman
Home Financials for this Owner
Home Financials are based on the most recent Mortgage that was taken out on this home.
Original Mortgage
$126,750
Outstanding Balance
$54,291
Interest Rate
5.83%
Estimated Equity
$308,459
Purchase Details
Closed on
Nov 6, 2000
Sold by
Robinson Valevely J and Robinson Thomas K
Bought by
Somsinsawasdi Prasert and Somsinsawasdi Noy V
Home Financials for this Owner
Home Financials are based on the most recent Mortgage that was taken out on this home.
Original Mortgage
$86,000
Interest Rate
7.88%
Create a Home Valuation Report for This Property
The Home Valuation Report is an in-depth analysis detailing your home's value as well as a comparison with similar homes in the area
Home Values in the Area
Average Home Value in this Area
Purchase History
| Date | Buyer | Sale Price | Title Company |
|---|---|---|---|
| Gonzalez Pardo Pedro Guzman | -- | None Available | |
| Pardo Pedro Guzman | -- | First American Title Company | |
| Pardo Pedro Guzman | $169,000 | First American Title Company | |
| Somsinsawasdi Prasert | $107,500 | Alliance Title Company |
Source: Public Records
Mortgage History
| Date | Status | Borrower | Loan Amount |
|---|---|---|---|
| Open | Pardo Pedro Guzman | $126,750 | |
| Previous Owner | Somsinsawasdi Prasert | $86,000 | |
| Closed | Pardo Pedro Guzman | $25,350 |
Source: Public Records
Tax History Compared to Growth
Tax History
| Year | Tax Paid | Tax Assessment Tax Assessment Total Assessment is a certain percentage of the fair market value that is determined by local assessors to be the total taxable value of land and additions on the property. | Land | Improvement |
|---|---|---|---|---|
| 2025 | $3,196 | $244,748 | $43,438 | $201,310 |
| 2024 | $3,196 | $239,950 | $42,587 | $197,363 |
| 2023 | $3,304 | $235,246 | $41,752 | $193,494 |
| 2022 | $3,121 | $230,634 | $40,934 | $189,700 |
| 2021 | $3,120 | $226,113 | $40,132 | $185,981 |
| 2020 | $3,061 | $223,795 | $39,721 | $184,074 |
| 2019 | $3,049 | $219,408 | $38,943 | $180,465 |
| 2018 | $2,828 | $215,107 | $38,180 | $176,927 |
| 2017 | $3,372 | $210,890 | $37,432 | $173,458 |
| 2016 | $2,698 | $200,101 | $35,517 | $164,584 |
| 2015 | $2,227 | $174,002 | $30,885 | $143,117 |
| 2014 | $2,094 | $156,758 | $27,824 | $128,934 |
Source: Public Records
Map
Nearby Homes
- 230 Du Bois Ave
- 335 Jessie Ave
- 328 Las Animas Cir
- 4323 Oconner Way
- 173 Bell Ave
- 2 Keely Ct
- 131 Mcdaniel Cir
- 3940 Norwood Ave
- 541 Samuel Way
- 400 Berthoud St
- 568 Samuel Way
- 1 Butterwick Ct
- 3815 Lee Brook Way
- Plan 7 at Valley Vista
- Plan 3 at Valley Vista
- Plan 7 at Valley Vista
- Plan 8 at Valley Vista
- Plan 8 at Valley Vista
- Plan 3 at Valley Vista
- Plan 1 at Valley Vista
- 4149 Fruita Ct
- 220 Jessie Ave
- 4139 Fruita Ct
- 4164 Englewood St
- 4154 Englewood St
- 210 Jessie Ave
- 4170 Fruita Ct
- 4144 Englewood St
- 4150 Fruita Ct
- 4190 Fruita Ct
- 4129 Fruita Ct
- 4140 Fruita Ct
- 4134 Englewood St
- 4130 Fruita Ct
- 4119 Fruita Ct
- 4124 Englewood St
- 4173 Newcastle St
- 4161 Newcastle St
- 4100 Fruita Ct
- 4185 Newcastle St