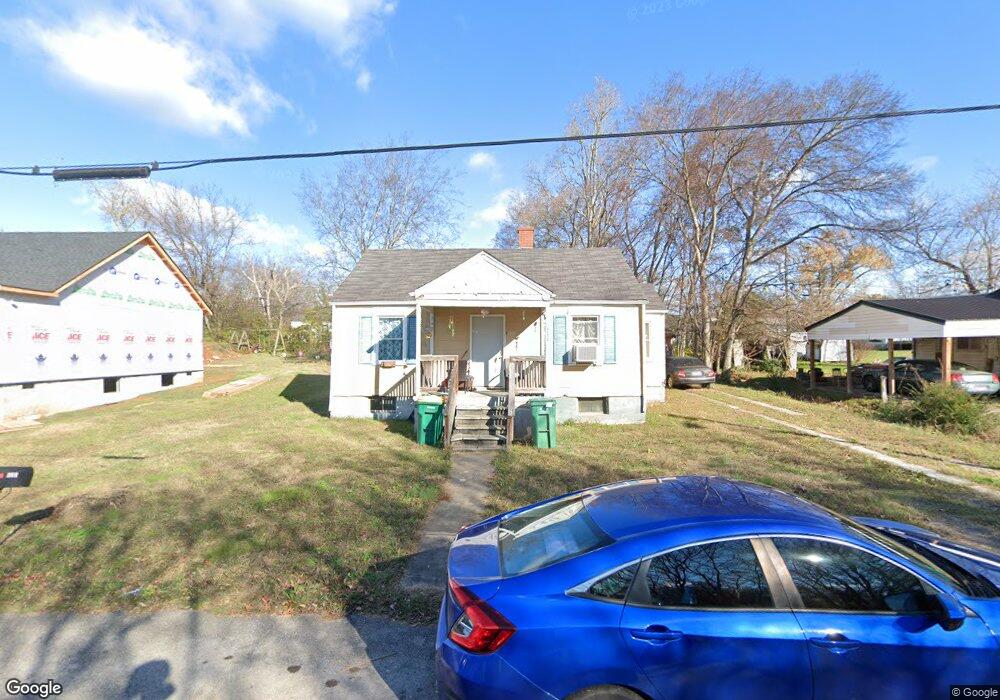
418 Cathey St Lewisburg, TN 37091
Estimated Value: $113,466 - $166,000
--
Bed
1
Bath
923
Sq Ft
$159/Sq Ft
Est. Value
About This Home
This home is located at 418 Cathey St, Lewisburg, TN 37091 and is currently estimated at $146,367, approximately $158 per square foot. 418 Cathey St is a home located in Marshall County with nearby schools including Marshall Elementary School, Oak Grove Elementary School, and Westhills Elementary School.
Ownership History
Date
Name
Owned For
Owner Type
Purchase Details
Closed on
Dec 13, 2013
Sold by
Cole J Kevin
Bought by
Cole J Kevin and Currier Joseph Wayne
Current Estimated Value
Purchase Details
Closed on
Dec 5, 2007
Sold by
Hsbc Bank Usa
Bought by
Kevin Cole J
Purchase Details
Closed on
Oct 29, 2007
Sold by
Joyce Primm
Bought by
Hsbc Bank Usa
Purchase Details
Closed on
Jun 30, 2005
Sold by
Patrick Smith
Bought by
Gregory Primm and Gregory Joyce
Home Financials for this Owner
Home Financials are based on the most recent Mortgage that was taken out on this home.
Original Mortgage
$49,300
Interest Rate
8.85%
Mortgage Type
Cash
Purchase Details
Closed on
Dec 31, 2004
Sold by
Charles Mcnutt
Bought by
Patrick Smith
Create a Home Valuation Report for This Property
The Home Valuation Report is an in-depth analysis detailing your home's value as well as a comparison with similar homes in the area
Home Values in the Area
Average Home Value in this Area
Purchase History
| Date | Buyer | Sale Price | Title Company |
|---|---|---|---|
| Cole J Kevin | $400,000 | -- | |
| Kevin Cole J | $25,000 | -- | |
| Hsbc Bank Usa | $39,100 | -- | |
| Gregory Primm | $58,000 | -- | |
| Patrick Smith | $24,000 | -- |
Source: Public Records
Mortgage History
| Date | Status | Borrower | Loan Amount |
|---|---|---|---|
| Previous Owner | Patrick Smith | $49,300 |
Source: Public Records
Tax History Compared to Growth
Tax History
| Year | Tax Paid | Tax Assessment Tax Assessment Total Assessment is a certain percentage of the fair market value that is determined by local assessors to be the total taxable value of land and additions on the property. | Land | Improvement |
|---|---|---|---|---|
| 2024 | -- | $15,625 | $3,125 | $12,500 |
| 2023 | $485 | $15,625 | $3,125 | $12,500 |
| 2022 | $485 | $15,625 | $3,125 | $12,500 |
| 2021 | $456 | $9,800 | $2,250 | $7,550 |
| 2020 | $514 | $9,800 | $2,250 | $7,550 |
| 2019 | $498 | $11,050 | $2,250 | $8,800 |
| 2018 | $492 | $11,050 | $2,250 | $8,800 |
| 2017 | $492 | $11,050 | $2,250 | $8,800 |
| 2016 | $487 | $9,500 | $2,125 | $7,375 |
| 2015 | $444 | $9,500 | $2,125 | $7,375 |
| 2014 | $444 | $9,500 | $2,125 | $7,375 |
Source: Public Records
Map
Nearby Homes