Estimated Value: $210,000 - $242,000
2
Beds
1
Bath
988
Sq Ft
$227/Sq Ft
Est. Value
About This Home
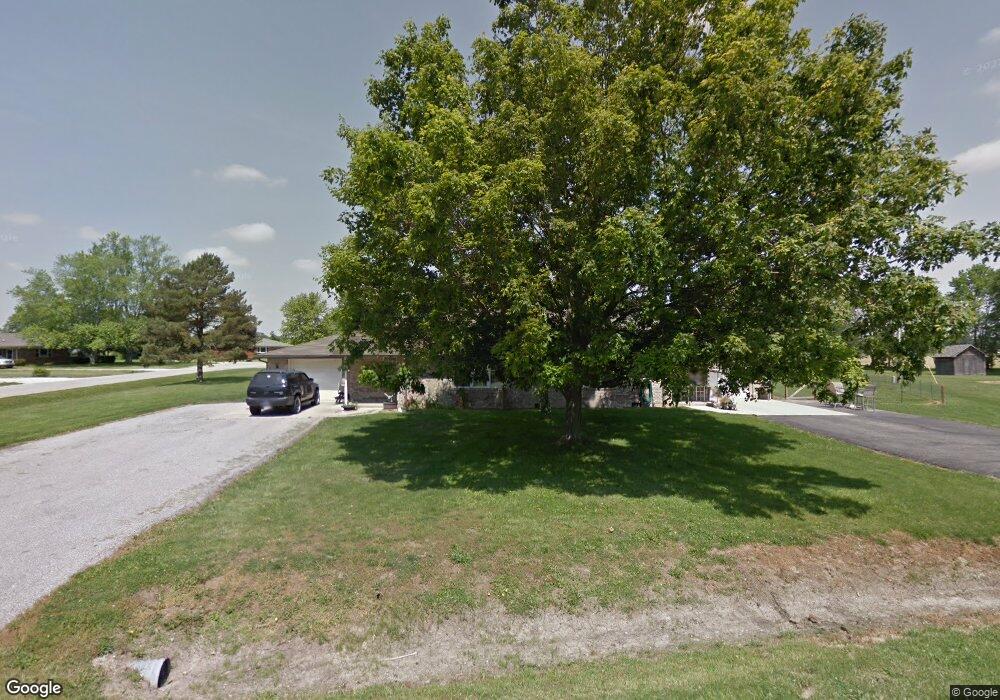
This home is located at 418 Cedar Glen Dr Unit 1, Avon, IN 46123 and is currently estimated at $223,826, approximately $226 per square foot. 418 Cedar Glen Dr Unit 1 is a home located in Hendricks County with nearby schools including White Oak Elementary School, River Birch Elementary School, and Avon Intermediate School East.
Ownership History
Date
Name
Owned For
Owner Type
Purchase Details
Closed on
Sep 20, 2012
Sold by
Combs Jack W and Combs Leslee A
Bought by
Spencer Ronnie W
Current Estimated Value
Purchase Details
Closed on
Apr 17, 2007
Sold by
Trout Timothy M and Trout Marti M
Bought by
Combs Jack W and Combs Leslie A
Home Financials for this Owner
Home Financials are based on the most recent Mortgage that was taken out on this home.
Original Mortgage
$126,900
Interest Rate
6.2%
Mortgage Type
New Conventional
Purchase Details
Closed on
Oct 29, 2003
Sold by
Horth Timothy W and Horth Dawn Harvey
Bought by
Trout Timothy M and Trout Marti M
Home Financials for this Owner
Home Financials are based on the most recent Mortgage that was taken out on this home.
Original Mortgage
$93,800
Interest Rate
6.04%
Mortgage Type
Purchase Money Mortgage
Create a Home Valuation Report for This Property
The Home Valuation Report is an in-depth analysis detailing your home's value as well as a comparison with similar homes in the area
Home Values in the Area
Average Home Value in this Area
Purchase History
| Date | Buyer | Sale Price | Title Company |
|---|---|---|---|
| Spencer Ronnie W | $130,000 | None Available | |
| Combs Jack W | -- | None Available | |
| Trout Timothy M | -- | -- |
Source: Public Records
Mortgage History
| Date | Status | Borrower | Loan Amount |
|---|---|---|---|
| Previous Owner | Combs Jack W | $126,900 | |
| Previous Owner | Trout Timothy M | $93,800 |
Source: Public Records
Tax History Compared to Growth
Tax History
| Year | Tax Paid | Tax Assessment Tax Assessment Total Assessment is a certain percentage of the fair market value that is determined by local assessors to be the total taxable value of land and additions on the property. | Land | Improvement |
|---|---|---|---|---|
| 2024 | $2,794 | $203,200 | $47,400 | $155,800 |
| 2023 | $2,676 | $190,800 | $38,900 | $151,900 |
| 2022 | $2,347 | $169,600 | $37,000 | $132,600 |
| 2021 | $2,227 | $157,800 | $37,000 | $120,800 |
| 2020 | $2,274 | $159,600 | $37,000 | $122,600 |
| 2019 | $1,909 | $140,800 | $37,000 | $103,800 |
| 2018 | $1,969 | $139,500 | $37,000 | $102,500 |
| 2017 | $1,605 | $133,300 | $35,200 | $98,100 |
| 2016 | $1,691 | $136,800 | $42,200 | $94,600 |
| 2014 | $1,980 | $134,600 | $41,800 | $92,800 |
Source: Public Records
Map
Nearby Homes
- 5291 Nettleton Way
- 227 Poplar Grove Dr
- 190 Poplar Grove Dr
- 5199 Nettleton Way
- 5259 Nettleton Way
- Chapman Plan at Easton - Northern
- Sullivan Plan at Easton - Southern
- Monroe Plan at Easton - Central
- Shafer Plan at Easton - Central
- Patoka Plan at Easton - Southern
- Atwood Plan at Easton - Northern
- Fletcher Plan at Easton - Central
- Briarwood Plan at Easton - Northern
- 5115 Nettleton Way
- 697 Bridgeman Rd
- 5319 Nettleton Way
- 5187 Nettleton Way
- 5267 Nettleton Way
- 5084 Foxley Park Ln
- 5076 Foxley Park Ln
- 418 Cedar Glen Dr
- 424 Cedar Glen Dr
- 418 Cedar Glen Dr
- 430 Cedar Glen Dr
- 430 Cedar Glen Dr
- 465 Greenbriar Ct Unit 467
- 430 Greenbriar Ct
- 423 Cedar Glen Dr
- 478 Greenbriar Ct Unit 480
- 454 Greenbriar Ct
- 405 Cedar Glen Dr
- 434 Cedar Glen Dr
- 472 Greenbriar Ct
- 348 Cedar Glen Dr
- 382 Pinedale Dr
- 335 Cedar Glen Dr
- 438 Cedar Glen Dr Unit 438
- 368 Pinedale Dr
- 440 Cedar Glen Dr
- 386 Pinedale Dr