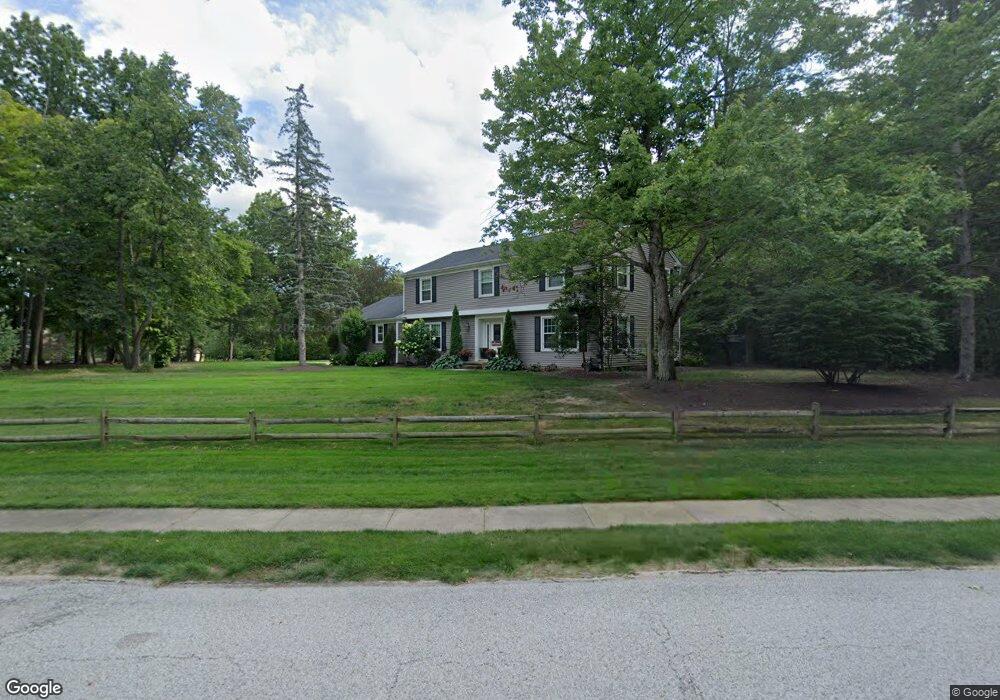
418 Fox Run Trail Aurora, OH 44202
Estimated Value: $462,000 - $536,000
4
Beds
3
Baths
2,591
Sq Ft
$192/Sq Ft
Est. Value
About This Home
This home is located at 418 Fox Run Trail, Aurora, OH 44202 and is currently estimated at $498,369, approximately $192 per square foot. 418 Fox Run Trail is a home located in Portage County with nearby schools including Miller Elementary School, Craddock/Miller Elementary School, and Leighton Elementary School.
Ownership History
Date
Name
Owned For
Owner Type
Purchase Details
Closed on
Oct 10, 2024
Sold by
Dale M Doherty Living Trust and Doherty Dale M
Bought by
Dale M Doherty Trust and Doherty
Current Estimated Value
Purchase Details
Closed on
May 5, 2008
Sold by
Doherty Dale Michele
Bought by
Doherty Dale M and The Dale M Doherty Living Trus
Purchase Details
Closed on
Oct 30, 2002
Sold by
Doherty Thomas David
Bought by
Doherty Dale Michele
Purchase Details
Closed on
Jun 27, 1995
Sold by
Worman Bradley F
Bought by
Doherty Thomas D and Doherty Dale M
Home Financials for this Owner
Home Financials are based on the most recent Mortgage that was taken out on this home.
Original Mortgage
$172,800
Interest Rate
7.13%
Mortgage Type
New Conventional
Create a Home Valuation Report for This Property
The Home Valuation Report is an in-depth analysis detailing your home's value as well as a comparison with similar homes in the area
Home Values in the Area
Average Home Value in this Area
Purchase History
| Date | Buyer | Sale Price | Title Company |
|---|---|---|---|
| Dale M Doherty Trust | -- | None Listed On Document | |
| Dale M Doherty Trust | -- | None Listed On Document | |
| Doherty Dale M | -- | Attorney | |
| Doherty Dale Michele | -- | -- | |
| Doherty Thomas D | $192,000 | -- |
Source: Public Records
Mortgage History
| Date | Status | Borrower | Loan Amount |
|---|---|---|---|
| Previous Owner | Doherty Thomas D | $172,800 |
Source: Public Records
Tax History Compared to Growth
Tax History
| Year | Tax Paid | Tax Assessment Tax Assessment Total Assessment is a certain percentage of the fair market value that is determined by local assessors to be the total taxable value of land and additions on the property. | Land | Improvement |
|---|---|---|---|---|
| 2024 | $6,952 | $155,510 | $28,000 | $127,510 |
| 2023 | $6,353 | $115,710 | $28,000 | $87,710 |
| 2022 | $5,753 | $115,710 | $28,000 | $87,710 |
| 2021 | $5,786 | $115,710 | $28,000 | $87,710 |
| 2020 | $5,214 | $97,060 | $28,000 | $69,060 |
| 2019 | $5,256 | $97,060 | $28,000 | $69,060 |
| 2018 | $5,361 | $90,270 | $25,590 | $64,680 |
| 2017 | $5,361 | $90,270 | $25,590 | $64,680 |
| 2016 | $4,831 | $90,270 | $25,590 | $64,680 |
| 2015 | $4,967 | $90,270 | $25,590 | $64,680 |
| 2014 | $4,998 | $89,010 | $25,590 | $63,420 |
| 2013 | $4,966 | $89,010 | $25,590 | $63,420 |
Source: Public Records
Map
Nearby Homes
- 179 Fox Run Trail
- 314 E Pioneer Trail
- 635 Prestige Woods Blvd
- 109 S Chillicothe Rd
- V/L Ohio 82
- 78 Chelmsford Dr
- 824 S Chillicothe Rd Unit 11
- 350 Aspen Ct
- 126 Greenbriar Dr
- 159 Royal Oak Dr
- 69 E Mennonite Rd
- 0 Aurora Hill Dr Unit 3956102
- 221 Greenbriar Dr
- 270 Parkview Dr
- 504-9 Concord Downs Cir Unit 9
- 985 Goldenrod Trail Unit 16K
- 415 Normandy Ct
- 540 Bent Creek Oval
- 339 Aberdeen Ln
- 398 N Chillicothe Rd
- 500 Fox Run Trail
- 475 Cobblestone Rd
- 489 Cobblestone Rd
- 506 Fox Run Trail
- 503 Fox Run Trail
- 405 New Hudson Rd
- 499 Fox Run Trail
- 469 Fox Run Trail
- 509 Cobblestone Rd
- 369 Fox Run Trail
- 505 Fox Run Trail
- 540 Fox Run Trail
- 369 New Hudson Rd
- 415 New Hudson Rd
- 341 Fox Run Trail
- 521 Cobblestone Rd
- 310 Fox Run Trail
- 521 Fox Run Trail
- 488 Cobblestone Rd
- 548 Fox Run Trail