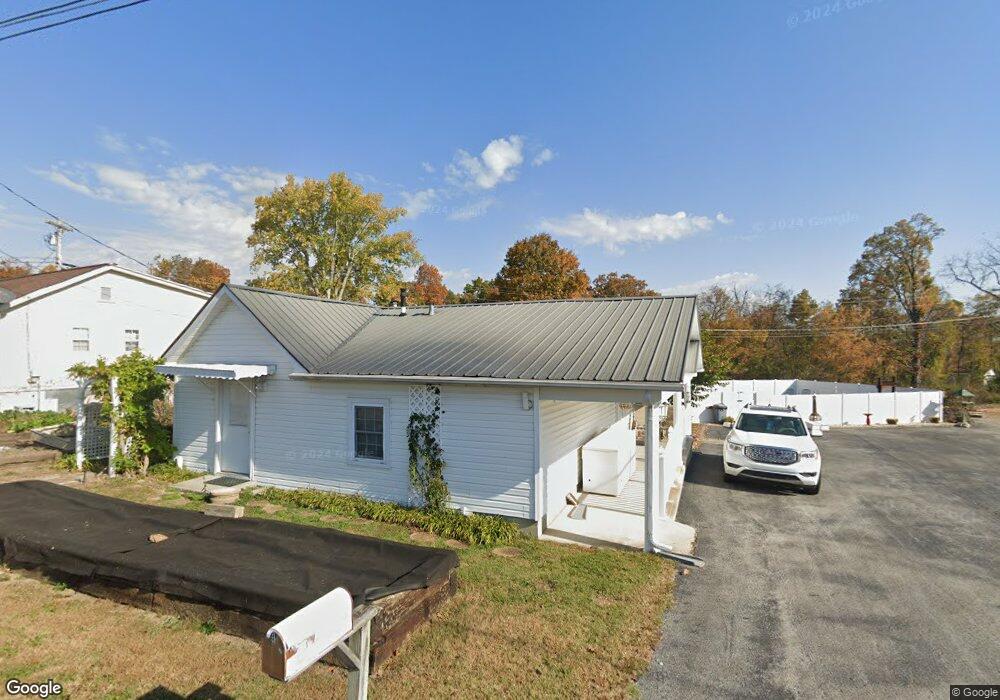
418 Greer St Jamestown, TN 38556
Estimated Value: $204,000 - $284,691
--
Bed
2
Baths
1,584
Sq Ft
$151/Sq Ft
Est. Value
About This Home
This home is located at 418 Greer St, Jamestown, TN 38556 and is currently estimated at $239,423, approximately $151 per square foot. 418 Greer St is a home located in Fentress County with nearby schools including Cumberland Christian School.
Ownership History
Date
Name
Owned For
Owner Type
Purchase Details
Closed on
Dec 16, 2016
Sold by
Sells Jearl Dean
Bought by
Jennings Billy H and Jennings Glenda
Current Estimated Value
Home Financials for this Owner
Home Financials are based on the most recent Mortgage that was taken out on this home.
Original Mortgage
$515,000
Outstanding Balance
$420,096
Interest Rate
3.94%
Mortgage Type
Stand Alone Refi Refinance Of Original Loan
Estimated Equity
-$180,673
Purchase Details
Closed on
Jul 25, 2013
Sold by
Jennings Billy H
Bought by
Jennings Billy H and Jennings Glenda
Home Financials for this Owner
Home Financials are based on the most recent Mortgage that was taken out on this home.
Original Mortgage
$132,000
Interest Rate
4.43%
Mortgage Type
Cash
Create a Home Valuation Report for This Property
The Home Valuation Report is an in-depth analysis detailing your home's value as well as a comparison with similar homes in the area
Home Values in the Area
Average Home Value in this Area
Purchase History
| Date | Buyer | Sale Price | Title Company |
|---|---|---|---|
| Jennings Billy H | $380,000 | -- | |
| Jennings Billy H | $131,000 | -- |
Source: Public Records
Mortgage History
| Date | Status | Borrower | Loan Amount |
|---|---|---|---|
| Open | Jennings Billy H | $515,000 | |
| Previous Owner | Jennings Billy H | $132,000 |
Source: Public Records
Tax History Compared to Growth
Tax History
| Year | Tax Paid | Tax Assessment Tax Assessment Total Assessment is a certain percentage of the fair market value that is determined by local assessors to be the total taxable value of land and additions on the property. | Land | Improvement |
|---|---|---|---|---|
| 2025 | -- | $50,625 | $0 | $0 |
| 2024 | -- | $50,625 | $12,500 | $38,125 |
| 2023 | $893 | $50,625 | $12,500 | $38,125 |
| 2022 | $768 | $29,200 | $6,250 | $22,950 |
| 2021 | $768 | $29,200 | $6,250 | $22,950 |
| 2020 | $558 | $29,200 | $6,250 | $22,950 |
| 2019 | $768 | $29,200 | $6,250 | $22,950 |
| 2018 | $768 | $29,200 | $6,250 | $22,950 |
| 2017 | $841 | $31,125 | $6,250 | $24,875 |
| 2016 | $841 | $31,125 | $6,250 | $24,875 |
| 2015 | $842 | $31,124 | $0 | $0 |
| 2014 | $842 | $31,124 | $0 | $0 |
Source: Public Records
Map
Nearby Homes