Estimated Value: $210,000 - $240,000
3
Beds
2
Baths
1,296
Sq Ft
$171/Sq Ft
Est. Value
About This Home
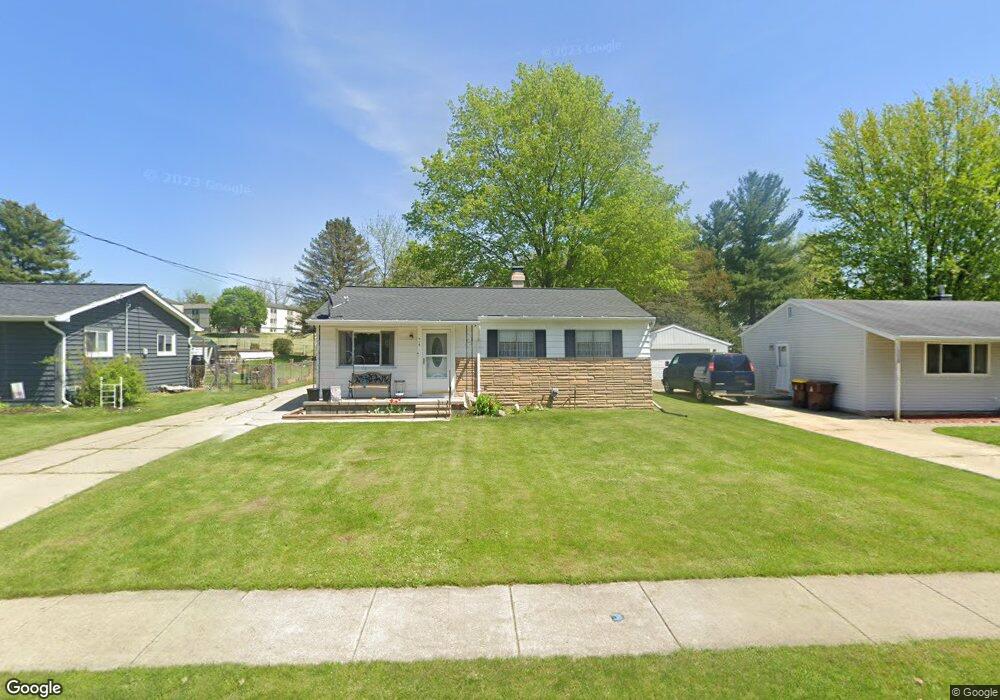
This home is located at 418 N Rogers St, Mason, MI 48854 and is currently estimated at $221,847, approximately $171 per square foot. 418 N Rogers St is a home located in Ingham County with nearby schools including Mason High School.
Ownership History
Date
Name
Owned For
Owner Type
Purchase Details
Closed on
May 9, 2025
Sold by
Gloden Jacqueline M
Bought by
Gloden Jacqueline M and Gloden Gary
Current Estimated Value
Purchase Details
Closed on
Dec 1, 1997
Sold by
Assaff Anthony L
Bought by
Gloden Jacqueline M
Purchase Details
Closed on
Oct 17, 1984
Sold by
Assaff Cheryl
Create a Home Valuation Report for This Property
The Home Valuation Report is an in-depth analysis detailing your home's value as well as a comparison with similar homes in the area
Home Values in the Area
Average Home Value in this Area
Purchase History
| Date | Buyer | Sale Price | Title Company |
|---|---|---|---|
| Gloden Jacqueline M | -- | None Listed On Document | |
| Gloden Jacqueline M | $85,000 | -- | |
| -- | $44,000 | -- |
Source: Public Records
Tax History Compared to Growth
Tax History
| Year | Tax Paid | Tax Assessment Tax Assessment Total Assessment is a certain percentage of the fair market value that is determined by local assessors to be the total taxable value of land and additions on the property. | Land | Improvement |
|---|---|---|---|---|
| 2025 | $3,275 | $106,930 | $26,370 | $80,560 |
| 2024 | $3,076 | $90,670 | $24,510 | $66,160 |
| 2023 | $3,076 | $81,120 | $24,350 | $56,770 |
| 2022 | $3,116 | $76,930 | $16,660 | $60,270 |
| 2021 | $2,872 | $76,010 | $16,660 | $59,350 |
| 2020 | $2,760 | $68,870 | $16,660 | $52,210 |
| 2019 | $2,839 | $64,760 | $12,120 | $52,640 |
| 2018 | $2,624 | $55,940 | $9,090 | $46,850 |
| 2017 | $2,530 | $55,940 | $9,090 | $46,850 |
| 2016 | -- | $52,690 | $7,880 | $44,810 |
| 2015 | -- | $51,870 | $15,751 | $36,119 |
| 2014 | -- | $48,010 | $25,747 | $22,263 |
Source: Public Records
Map
Nearby Homes
- 32 Aviemore Dr Unit 32
- 434 Ravenwood Ct
- 0 Sanctuary
- 990 Windjammer Ct
- 117 Lawton St
- 327 Steele St
- 427 E Ash St
- 411 Bubbling Springs Ct
- 202 Stratford Dr
- 317 E Elm St
- 116 E Elm St
- 1470 N Cedar St
- 404 E Cherry St
- 833 S Barnes St
- 209 Peachtree Place
- 330 Oak Ridge St
- 902 Eagles Nest Ct
- 105 Carom Cir
- 311 Carom Cir
- 915 Carom Cir