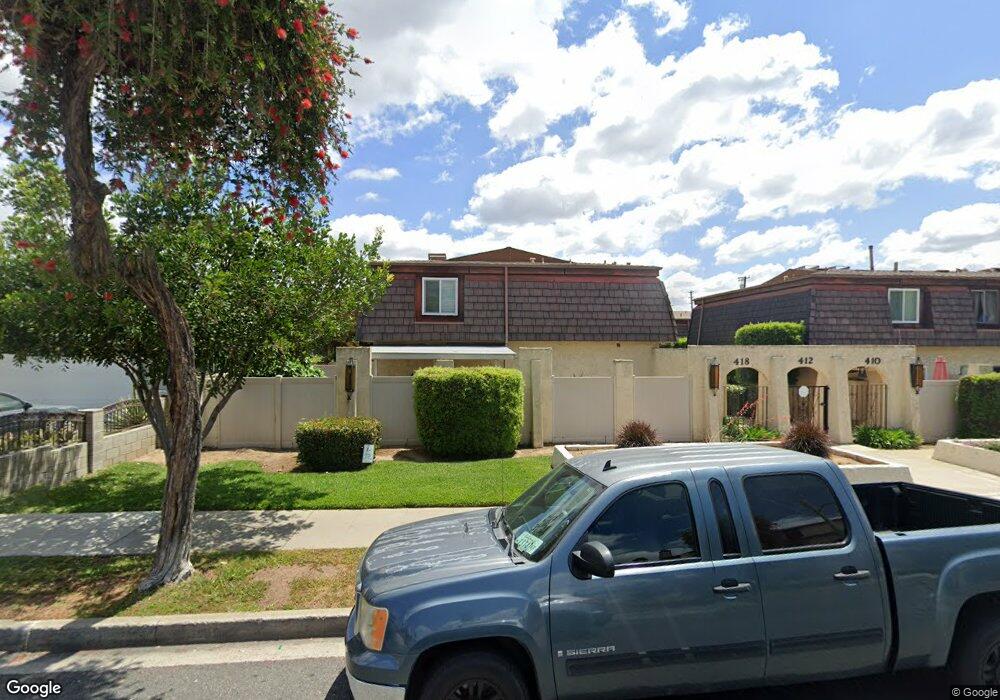
418 N Ynez Ave Unit E Monterey Park, CA 91754
Estimated Value: $673,000 - $725,000
3
Beds
3
Baths
1,185
Sq Ft
$582/Sq Ft
Est. Value
About This Home
This home is located at 418 N Ynez Ave Unit E, Monterey Park, CA 91754 and is currently estimated at $689,728, approximately $582 per square foot. 418 N Ynez Ave Unit E is a home located in Los Angeles County with nearby schools including Ynez Elementary School, Mark Keppel High School, and St. Stephen Martyr School.
Ownership History
Date
Name
Owned For
Owner Type
Purchase Details
Closed on
Dec 18, 2009
Sold by
Trieu Khem and Dinh Suong Thi
Bought by
Mei Lin Bo and Mei Li Ying
Current Estimated Value
Home Financials for this Owner
Home Financials are based on the most recent Mortgage that was taken out on this home.
Original Mortgage
$276,000
Outstanding Balance
$178,911
Interest Rate
4.78%
Mortgage Type
New Conventional
Estimated Equity
$510,817
Purchase Details
Closed on
May 20, 2009
Sold by
Trieu Khem and Dinh Suong Thi
Bought by
Trieu Khem and Dinh Suong Thi
Home Financials for this Owner
Home Financials are based on the most recent Mortgage that was taken out on this home.
Original Mortgage
$240,000
Interest Rate
4.83%
Mortgage Type
New Conventional
Purchase Details
Closed on
Feb 16, 2009
Sold by
Trieu Khem and Dinh Suong Thi
Bought by
Trieu Khem and Dinh Suong Thi
Create a Home Valuation Report for This Property
The Home Valuation Report is an in-depth analysis detailing your home's value as well as a comparison with similar homes in the area
Home Values in the Area
Average Home Value in this Area
Purchase History
| Date | Buyer | Sale Price | Title Company |
|---|---|---|---|
| Mei Lin Bo | $368,000 | Fatcola | |
| Trieu Khem | -- | Ticor Title Company | |
| Trieu Khem | -- | Ticor | |
| Trieu Khem | -- | None Available |
Source: Public Records
Mortgage History
| Date | Status | Borrower | Loan Amount |
|---|---|---|---|
| Open | Mei Lin Bo | $276,000 | |
| Previous Owner | Trieu Khem | $240,000 |
Source: Public Records
Tax History Compared to Growth
Tax History
| Year | Tax Paid | Tax Assessment Tax Assessment Total Assessment is a certain percentage of the fair market value that is determined by local assessors to be the total taxable value of land and additions on the property. | Land | Improvement |
|---|---|---|---|---|
| 2025 | $6,137 | $475,009 | $219,434 | $255,575 |
| 2024 | $6,137 | $465,696 | $215,132 | $250,564 |
| 2023 | $6,010 | $456,565 | $210,914 | $245,651 |
| 2022 | $5,724 | $447,614 | $206,779 | $240,835 |
| 2021 | $5,654 | $438,838 | $202,725 | $236,113 |
| 2019 | $5,450 | $425,823 | $196,713 | $229,110 |
| 2018 | $5,464 | $417,474 | $192,856 | $224,618 |
| 2016 | $5,052 | $401,265 | $185,368 | $215,897 |
| 2015 | $4,972 | $395,239 | $182,584 | $212,655 |
| 2014 | $4,903 | $387,498 | $179,008 | $208,490 |
Source: Public Records
Map
Nearby Homes
- 513 W Emerson Ave Unit C
- 500 N Moore Ave Unit E
- 516 N Moore Ave Unit A
- 419 N Chandler Ave Unit 508
- 419 N Chandler Ave Unit 311
- 419 N Chandler Ave Unit 308
- 419 N Chandler Ave Unit 413
- 419 N Chandler Ave Unit 305
- 419 N Chandler Ave Unit 319
- 215 W Garcelon Ave
- 305 N Baltimore Ave Unit C
- 2037 S 3rd St
- 612 W Ramona Rd
- 600 N Atlantic Blvd Unit 516
- 600 N Atlantic Blvd Unit 508
- 600 N Atlantic Blvd Unit 207
- 0 N Atlantic Blvd Unit WS23107010
- 125 S Moore Ave Unit 2
- 215 N Lincoln Ave
- 406 N Lincoln Ave Unit A
- 410 N Ynez Ave Unit Q
- 410 N Ynez Ave Unit N-7
- 410 N Ynez Ave Unit D-7
- 410 N Ynez Ave Unit M
- 410 N Ynez Ave Unit R
- 410 N Ynez Ave Unit 9
- 410 N Ynez Ave Unit P
- 410 N Ynez Ave Unit 7
- 418 N Ynez Ave Unit M
- 418 N Ynez Ave Unit 4D
- 418 N Ynez Ave Unit C
- 418 N Ynez Ave Unit B
- 418 N Ynez Ave Unit A
- 412 N Ynez Ave Unit G
- 412 N Ynez Ave Unit F
- 412 N Ynez Ave Unit 15G
- 412 N Ynez Ave Unit H
- 412 N Ynez Ave Unit J
- 412 N Ynez Ave Unit K
- 412 N Ynez Ave Unit L