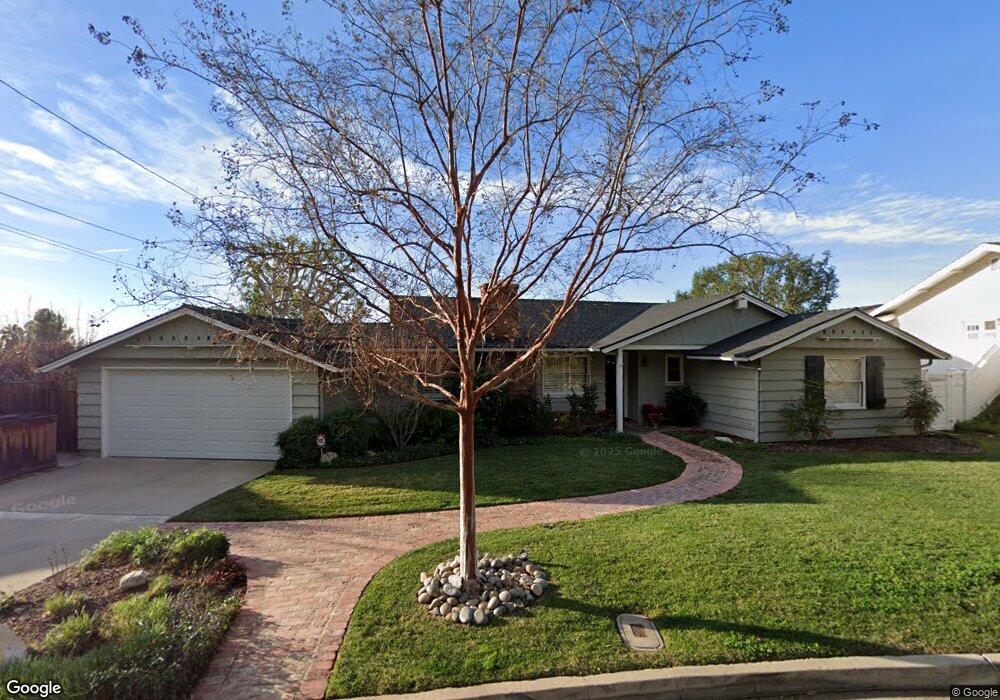
418 Noren St La Canada Flintridge, CA 91011
Estimated Value: $1,889,037 - $2,169,000
3
Beds
2
Baths
1,605
Sq Ft
$1,267/Sq Ft
Est. Value
About This Home
This home is located at 418 Noren St, La Canada Flintridge, CA 91011 and is currently estimated at $2,033,009, approximately $1,266 per square foot. 418 Noren St is a home located in Los Angeles County with nearby schools including Paradise Canyon Elementary School, La Canada High School, and La Canada Preparatory School.
Ownership History
Date
Name
Owned For
Owner Type
Purchase Details
Closed on
Feb 15, 2013
Sold by
Canton Gilbert and Canton Kathryn
Bought by
Canton Gilbert Samson and Canton Kathryn Hawkins
Current Estimated Value
Purchase Details
Closed on
Jun 10, 2010
Sold by
Williams Scott C and Williams Marianne
Bought by
Canton Gilbert and Canton Kathryn
Home Financials for this Owner
Home Financials are based on the most recent Mortgage that was taken out on this home.
Original Mortgage
$679,200
Outstanding Balance
$450,486
Interest Rate
4.76%
Mortgage Type
New Conventional
Estimated Equity
$1,582,523
Purchase Details
Closed on
Jul 18, 1997
Sold by
Peters Theodore W Co Tr Peters Trust
Bought by
Williams Scott C and Williams Marianne
Home Financials for this Owner
Home Financials are based on the most recent Mortgage that was taken out on this home.
Original Mortgage
$297,600
Interest Rate
7.34%
Purchase Details
Closed on
Jul 8, 1995
Sold by
Peters Theodore W and Peters Family Trust
Bought by
Peters Theodore W and Peters Family Trust
Create a Home Valuation Report for This Property
The Home Valuation Report is an in-depth analysis detailing your home's value as well as a comparison with similar homes in the area
Home Values in the Area
Average Home Value in this Area
Purchase History
| Date | Buyer | Sale Price | Title Company |
|---|---|---|---|
| Canton Gilbert Samson | -- | None Available | |
| Canton Gilbert | $849,000 | Chicago Title | |
| Williams Scott C | $372,000 | Old Republic Title Company | |
| Peters Theodore W | -- | -- |
Source: Public Records
Mortgage History
| Date | Status | Borrower | Loan Amount |
|---|---|---|---|
| Open | Canton Gilbert | $679,200 | |
| Previous Owner | Williams Scott C | $297,600 | |
| Closed | Williams Scott C | $37,200 |
Source: Public Records
Tax History Compared to Growth
Tax History
| Year | Tax Paid | Tax Assessment Tax Assessment Total Assessment is a certain percentage of the fair market value that is determined by local assessors to be the total taxable value of land and additions on the property. | Land | Improvement |
|---|---|---|---|---|
| 2025 | $12,564 | $1,087,707 | $870,171 | $217,536 |
| 2024 | $12,564 | $1,066,380 | $853,109 | $213,271 |
| 2023 | $12,256 | $1,045,472 | $836,382 | $209,090 |
| 2022 | $11,764 | $1,024,974 | $819,983 | $204,991 |
| 2021 | $11,686 | $1,004,877 | $803,905 | $200,972 |
| 2019 | $11,333 | $975,073 | $780,061 | $195,012 |
| 2018 | $11,062 | $955,955 | $764,766 | $191,189 |
| 2016 | $11,243 | $918,836 | $735,070 | $183,766 |
| 2015 | $11,097 | $905,035 | $724,029 | $181,006 |
| 2014 | $10,952 | $887,308 | $709,847 | $177,461 |
Source: Public Records
Map
Nearby Homes
- 5419 Godbey Dr
- 5311 Pali Point Ln
- 5213 Diamond Point Rd
- 4826 Indianola Way
- 5117 Stoneglen Rd
- 4537 Indianola Way
- 4544 Daleridge Rd
- 4428 Oakwood Ave
- 909 Coral Way
- 500 Georgian Rd
- 4825 Angeles Crest Hwy
- 4901 Angeles Crest Cir
- 848 Greenridge Dr
- 4257 Chula Senda Ln
- 4031 Canyon Dell Dr
- 4156 Aralia Rd
- 5805 Briartree Dr
- 4369 El Prieto Rd
- 5148 Angeles Crest Hwy
- 5350 Harter Ln