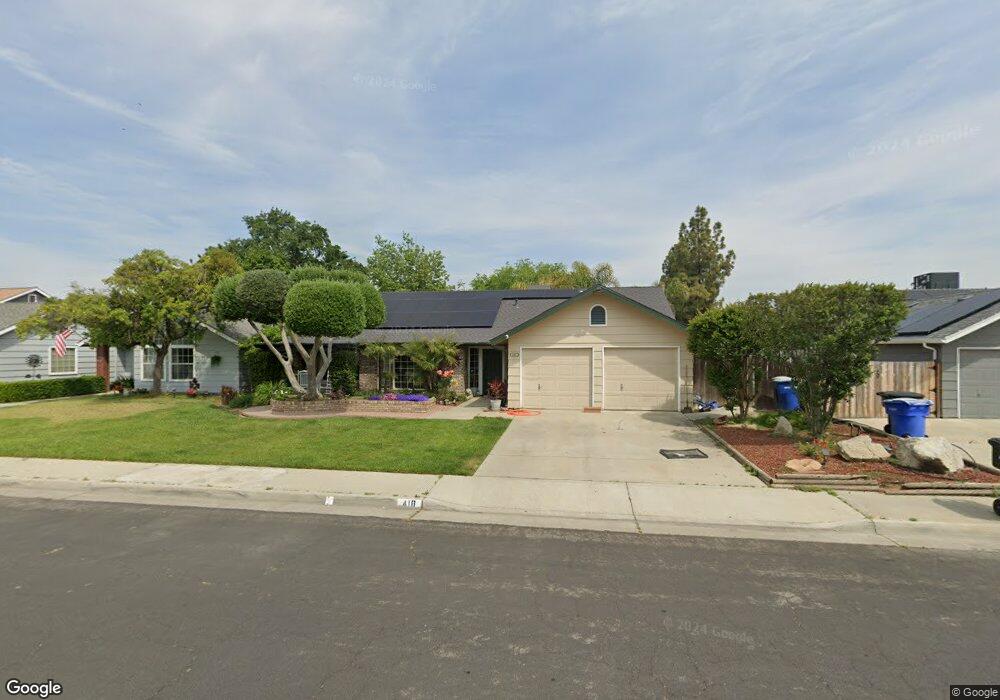
418 Palm Cir Hanford, CA 93230
Estimated Value: $426,000 - $477,000
3
Beds
2
Baths
1,919
Sq Ft
$234/Sq Ft
Est. Value
About This Home
This home is located at 418 Palm Cir, Hanford, CA 93230 and is currently estimated at $449,022, approximately $233 per square foot. 418 Palm Cir is a home located in Kings County with nearby schools including Hanford West High School, Frontier Elementary School, and Pioneer Middle School.
Ownership History
Date
Name
Owned For
Owner Type
Purchase Details
Closed on
May 12, 2006
Sold by
Bracken Thomas James and Bracken Angela L
Bought by
Macias James and Macias Bridgette R
Current Estimated Value
Home Financials for this Owner
Home Financials are based on the most recent Mortgage that was taken out on this home.
Original Mortgage
$306,000
Interest Rate
8.99%
Mortgage Type
Purchase Money Mortgage
Purchase Details
Closed on
Sep 23, 2002
Sold by
Bracken Thomas James and Bracken Angela L
Bought by
Bracken Thomas James and Bracken Angela L
Create a Home Valuation Report for This Property
The Home Valuation Report is an in-depth analysis detailing your home's value as well as a comparison with similar homes in the area
Home Values in the Area
Average Home Value in this Area
Purchase History
| Date | Buyer | Sale Price | Title Company |
|---|---|---|---|
| Macias James | $309,000 | Chicago Title Co | |
| Bracken Thomas James | -- | -- | |
| Bracken Thomas James | -- | -- |
Source: Public Records
Mortgage History
| Date | Status | Borrower | Loan Amount |
|---|---|---|---|
| Previous Owner | Macias James | $306,000 |
Source: Public Records
Tax History Compared to Growth
Tax History
| Year | Tax Paid | Tax Assessment Tax Assessment Total Assessment is a certain percentage of the fair market value that is determined by local assessors to be the total taxable value of land and additions on the property. | Land | Improvement |
|---|---|---|---|---|
| 2025 | $4,454 | $413,993 | $133,978 | $280,015 |
| 2023 | $4,454 | $397,919 | $128,776 | $269,143 |
| 2022 | $4,315 | $390,117 | $126,251 | $263,866 |
| 2021 | $3,934 | $355,000 | $87,000 | $268,000 |
| 2020 | $3,648 | $325,000 | $86,700 | $238,300 |
| 2019 | $3,161 | $280,500 | $85,000 | $195,500 |
| 2018 | $3,143 | $275,000 | $85,000 | $190,000 |
| 2017 | $2,978 | $260,000 | $85,000 | $175,000 |
| 2016 | $2,327 | $210,525 | $70,000 | $140,525 |
| 2015 | $2,181 | $200,500 | $60,000 | $140,500 |
| 2014 | $1,915 | $171,274 | $60,272 | $111,002 |
Source: Public Records
Map
Nearby Homes