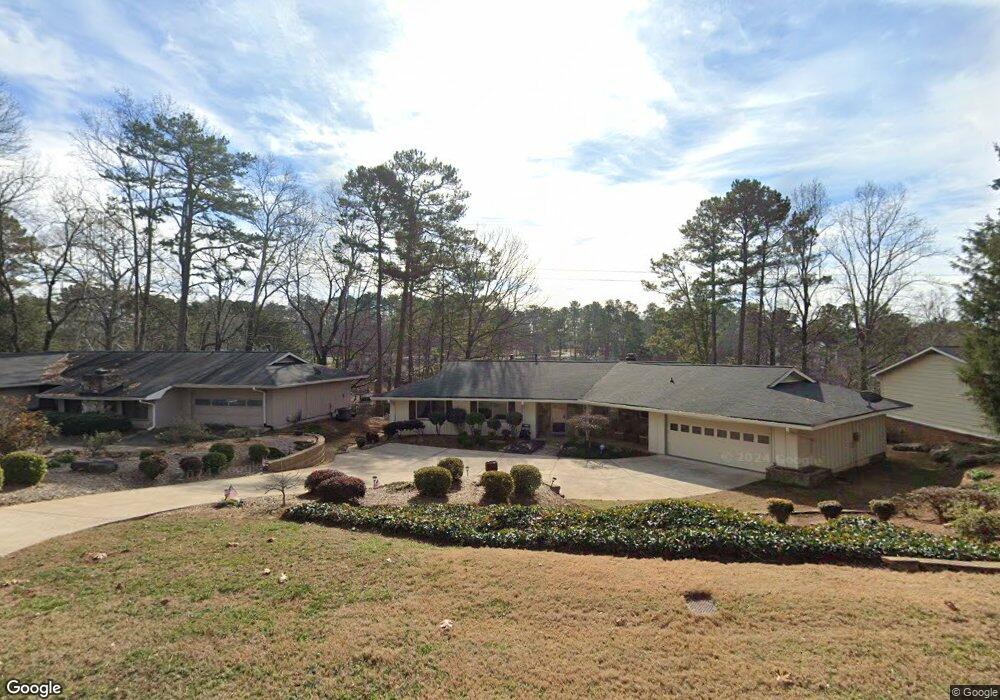
4180 Summit Dr Marietta, GA 30068
Indian Hills Country Club NeighborhoodEstimated Value: $759,000 - $1,020,020
3
Beds
2
Baths
2,175
Sq Ft
$395/Sq Ft
Est. Value
About This Home
This home is located at 4180 Summit Dr, Marietta, GA 30068 and is currently estimated at $858,255, approximately $394 per square foot. 4180 Summit Dr is a home located in Cobb County with nearby schools including East Side Elementary School, Dickerson Middle School, and Walton High School.
Ownership History
Date
Name
Owned For
Owner Type
Purchase Details
Closed on
Jul 6, 2021
Sold by
Kollias Athanasios Z and Kollias Loretta J
Bought by
Kollias Athanasios Z and The Athanasios Z Kollias Revoc
Current Estimated Value
Purchase Details
Closed on
Apr 10, 2007
Sold by
Taylor Sandra G
Bought by
Kollias Loretta J and Kollias Athanasaios Z
Home Financials for this Owner
Home Financials are based on the most recent Mortgage that was taken out on this home.
Original Mortgage
$270,000
Outstanding Balance
$163,249
Interest Rate
6.15%
Mortgage Type
New Conventional
Estimated Equity
$695,006
Purchase Details
Closed on
Jun 13, 2005
Sold by
Donnon Al
Bought by
Taylor Sandra G
Purchase Details
Closed on
Jun 24, 2004
Sold by
Oliverio Nancy L
Bought by
Donnon Al
Purchase Details
Closed on
Jun 20, 2001
Sold by
Hudson Martha A
Bought by
Burroughs Samuel
Home Financials for this Owner
Home Financials are based on the most recent Mortgage that was taken out on this home.
Original Mortgage
$175,300
Interest Rate
6.97%
Mortgage Type
New Conventional
Create a Home Valuation Report for This Property
The Home Valuation Report is an in-depth analysis detailing your home's value as well as a comparison with similar homes in the area
Home Values in the Area
Average Home Value in this Area
Purchase History
| Date | Buyer | Sale Price | Title Company |
|---|---|---|---|
| Kollias Athanasios Z | -- | None Available | |
| Kollias Loretta J | $359,000 | -- | |
| Taylor Sandra G | $323,000 | -- | |
| Donnon Al | $222,000 | -- | |
| Burroughs Samuel | $195,000 | -- |
Source: Public Records
Mortgage History
| Date | Status | Borrower | Loan Amount |
|---|---|---|---|
| Open | Kollias Loretta J | $270,000 | |
| Previous Owner | Burroughs Samuel | $175,300 |
Source: Public Records
Tax History Compared to Growth
Tax History
| Year | Tax Paid | Tax Assessment Tax Assessment Total Assessment is a certain percentage of the fair market value that is determined by local assessors to be the total taxable value of land and additions on the property. | Land | Improvement |
|---|---|---|---|---|
| 2024 | $1,569 | $211,772 | $90,000 | $121,772 |
| 2023 | $1,365 | $212,404 | $83,200 | $129,204 |
| 2022 | $1,482 | $182,564 | $83,200 | $99,364 |
| 2021 | $1,459 | $175,068 | $83,200 | $91,868 |
| 2020 | $1,515 | $193,592 | $83,200 | $110,392 |
| 2019 | $1,515 | $193,592 | $83,200 | $110,392 |
| 2018 | $1,405 | $156,976 | $64,000 | $92,976 |
| 2017 | $1,233 | $156,976 | $64,000 | $92,976 |
| 2016 | $1,207 | $147,376 | $64,000 | $83,376 |
| 2015 | $1,196 | $120,600 | $48,000 | $72,600 |
| 2014 | $1,218 | $120,600 | $0 | $0 |
Source: Public Records
Map
Nearby Homes
- 4002 Edgewood Ct Unit 9
- 4201 Fairgreen Terrace NE
- 4232 Edgewood Ct
- 4250 Summit Dr
- 575 Indian Hills Pkwy
- 786 Fairfield Dr
- 4096 Audubon Dr Unit 4096
- 870 Muirfield Trace
- 4037 Fawn Run
- 633 Cagle Rd
- 411 Woodstone Dr W
- 3948 Cliffmont Cir
- 3830 Valley Green Dr
- 1164 Fairfield Dr
- 3760 Creekstone Way
- 4300 Cove Island Dr NE
- 4569 Fountain Dr NE
- 1097 Princeton Walk NE Unit 1A
- 4190 Summit Dr Unit 9
- 4170 Summit Dr
- 4200 Summit Dr Unit 9
- 4160 Summit Dr
- 4171 Summit Dr
- 730 Summit Terrace
- 704 Summit Terrace
- 706 Summit Terrace
- 710 Summit Terrace
- 716 Summit Terrace
- 726 Summit Terrace
- 726 Summit Terrace Unit 726
- 4191 Summit Dr
- 4150 Summit Dr
- 740 Summit Terrace
- 4210 Summit Dr
- 4151 Summit Dr
- 709 Summit Terrace
- 711 Summit Terrace
- 0 Summit Terrace Unit 8605946