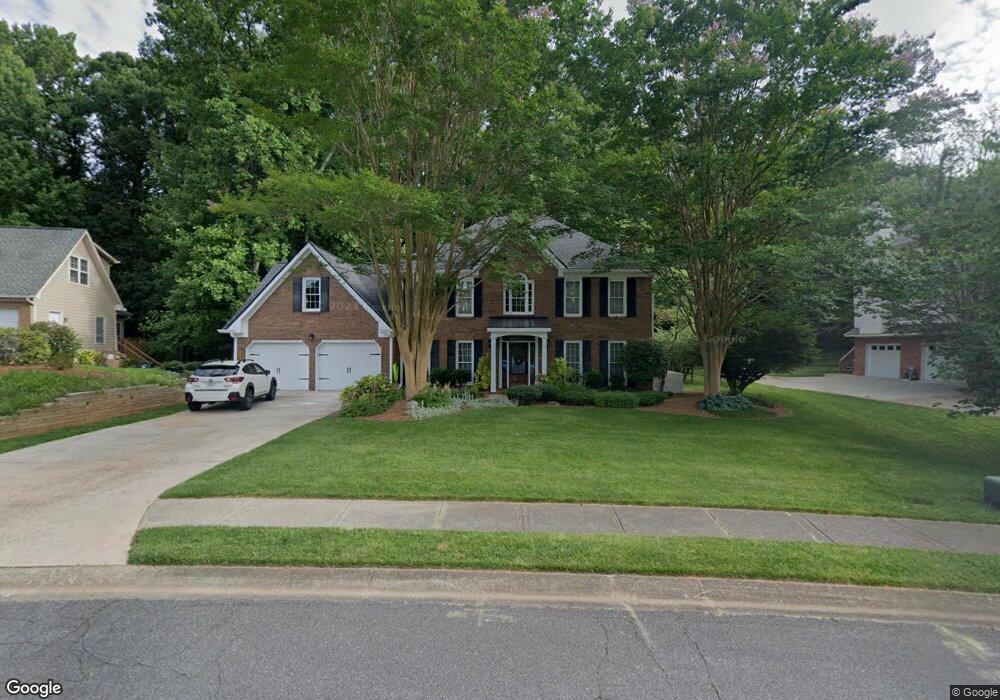
4184 Long Branch Dr NE Unit 1 Marietta, GA 30066
Sandy Plains NeighborhoodEstimated Value: $521,000 - $708,000
4
Beds
3
Baths
2,755
Sq Ft
$229/Sq Ft
Est. Value
About This Home
This home is located at 4184 Long Branch Dr NE Unit 1, Marietta, GA 30066 and is currently estimated at $631,917, approximately $229 per square foot. 4184 Long Branch Dr NE Unit 1 is a home located in Cobb County with nearby schools including Davis Elementary School, Mabry Middle School, and Lassiter High School.
Ownership History
Date
Name
Owned For
Owner Type
Purchase Details
Closed on
Sep 29, 2022
Sold by
Bells Ferry Road Development Llc
Bought by
Brock Built Homes Llc
Current Estimated Value
Purchase Details
Closed on
May 28, 2003
Sold by
Lamb Robert L and Lamb Janice L
Bought by
Raby Daniel C and Raby Gail
Home Financials for this Owner
Home Financials are based on the most recent Mortgage that was taken out on this home.
Original Mortgage
$75,000
Interest Rate
5.79%
Mortgage Type
New Conventional
Purchase Details
Closed on
Oct 22, 1993
Sold by
Lorenzini Michael A
Bought by
Lamb Robert L Janice L
Home Financials for this Owner
Home Financials are based on the most recent Mortgage that was taken out on this home.
Original Mortgage
$131,000
Interest Rate
7.07%
Create a Home Valuation Report for This Property
The Home Valuation Report is an in-depth analysis detailing your home's value as well as a comparison with similar homes in the area
Home Values in the Area
Average Home Value in this Area
Purchase History
| Date | Buyer | Sale Price | Title Company |
|---|---|---|---|
| Brock Built Homes Llc | $465,000 | -- | |
| Raby Daniel C | $256,000 | -- | |
| Lamb Robert L Janice L | $163,800 | -- |
Source: Public Records
Mortgage History
| Date | Status | Borrower | Loan Amount |
|---|---|---|---|
| Previous Owner | Raby Daniel C | $75,000 | |
| Previous Owner | Lamb Robert L Janice L | $131,000 |
Source: Public Records
Tax History Compared to Growth
Tax History
| Year | Tax Paid | Tax Assessment Tax Assessment Total Assessment is a certain percentage of the fair market value that is determined by local assessors to be the total taxable value of land and additions on the property. | Land | Improvement |
|---|---|---|---|---|
| 2025 | $1,357 | $215,384 | $54,000 | $161,384 |
| 2024 | $5,202 | $215,384 | $54,000 | $161,384 |
| 2023 | $4,755 | $219,780 | $54,000 | $165,780 |
| 2022 | $3,915 | $154,708 | $40,000 | $114,708 |
| 2021 | $3,753 | $147,328 | $30,000 | $117,328 |
| 2020 | $3,753 | $147,328 | $30,000 | $117,328 |
| 2019 | $3,753 | $147,328 | $30,000 | $117,328 |
| 2018 | $3,329 | $127,956 | $30,000 | $97,956 |
| 2017 | $3,198 | $127,956 | $30,000 | $97,956 |
| 2016 | $3,202 | $127,956 | $30,000 | $97,956 |
| 2015 | $2,965 | $114,148 | $30,000 | $84,148 |
| 2014 | $2,747 | $103,404 | $0 | $0 |
Source: Public Records
Map
Nearby Homes
- 4219 N Mountain Rd NE
- 4302 Highborne Dr NE Unit 3
- 4243 N Mountain Rd NE
- 3333 Devaughn Dr NE
- 4380 Wood Creek Dr
- 3350 Brookhill Cir
- 4397 Windsor Oaks Cir
- 4563 Ashmore Cir NE
- 3480 Pebble Hill Dr
- 4734 Outlook Way NE
- 4032 Ashmont Ct
- 3043 Sawyer Trace NE
- 3870 Sweat Creek Run
- 3130 Maley Ct
- 3851 Timber Hollow Way
- 4019 Wesley Chapel Rd
- 4589 Wigley Estates Rd
- 2855 Lamer Trace
- 4182 Long Branch Dr NE
- 4186 Long Branch Dr NE
- 4185 Long Branch Dr NE
- 4222 N Mountain Rd NE
- 4209 Long Branch Ct NE Unit 1
- 4220 N Mountain Rd NE
- 4183 Long Branch Dr NE
- 4187 Long Branch Dr NE Unit 1
- 0 Long Branch Ct NE Unit 7532722
- 0 Long Branch Ct NE Unit 7522238
- 0 Long Branch Ct NE Unit 7296982
- 0 Long Branch Ct NE Unit 8261970
- 0 Long Branch Ct NE
- 4224 N Mountain Rd NE Unit I
- 4218 N Mountain Rd NE
- 4208 Long Branch Ct NE
- 4189 Long Branch Dr NE
- 4226 N Mountain Rd NE
- 4192 Long Branch Dr NE
- 4216 N Mountain Rd NE