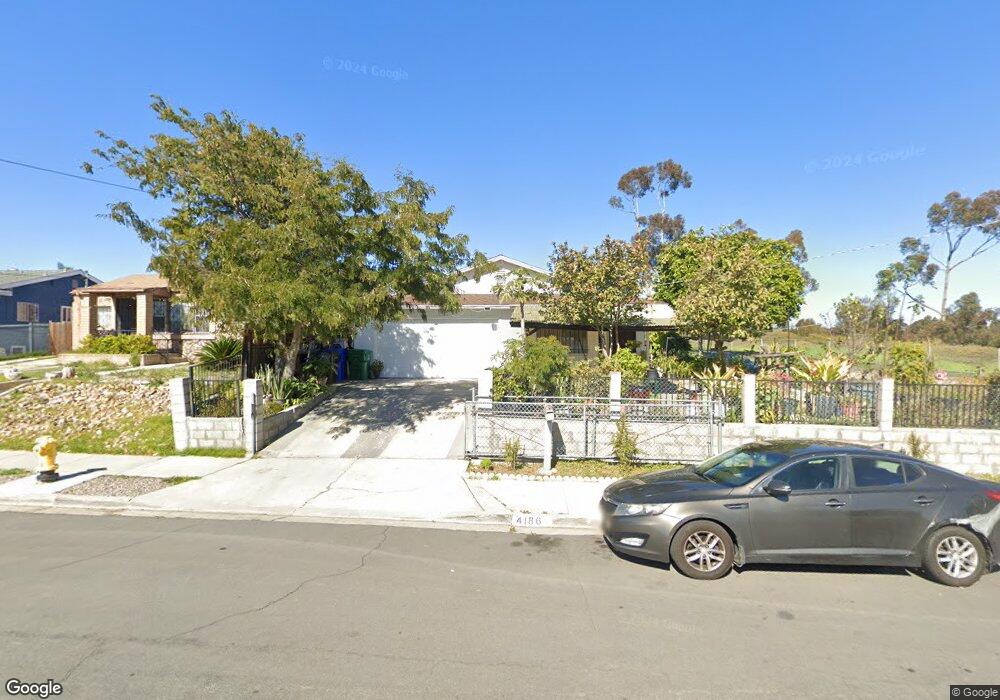
4186 Broadway San Diego, CA 92102
Mount Hope NeighborhoodEstimated Value: $611,000 - $758,000
3
Beds
2
Baths
1,145
Sq Ft
$589/Sq Ft
Est. Value
About This Home
This home is located at 4186 Broadway, San Diego, CA 92102 and is currently estimated at $673,904, approximately $588 per square foot. 4186 Broadway is a home located in San Diego County with nearby schools including Chollas/Mead Elementary School, Millennial Tech Middle School, and Lincoln High School.
Ownership History
Date
Name
Owned For
Owner Type
Purchase Details
Closed on
Dec 15, 2000
Sold by
Lamanivong and Thongsy
Bought by
Sydoungphachanh Venephet Peter
Current Estimated Value
Home Financials for this Owner
Home Financials are based on the most recent Mortgage that was taken out on this home.
Original Mortgage
$96,000
Outstanding Balance
$34,638
Interest Rate
7.41%
Estimated Equity
$639,266
Purchase Details
Closed on
Jun 26, 1987
Create a Home Valuation Report for This Property
The Home Valuation Report is an in-depth analysis detailing your home's value as well as a comparison with similar homes in the area
Home Values in the Area
Average Home Value in this Area
Purchase History
| Date | Buyer | Sale Price | Title Company |
|---|---|---|---|
| Sydoungphachanh Venephet Peter | $120,000 | Chicago Title Co | |
| -- | $74,000 | -- |
Source: Public Records
Mortgage History
| Date | Status | Borrower | Loan Amount |
|---|---|---|---|
| Open | Sydoungphachanh Venephet Peter | $96,000 |
Source: Public Records
Tax History Compared to Growth
Tax History
| Year | Tax Paid | Tax Assessment Tax Assessment Total Assessment is a certain percentage of the fair market value that is determined by local assessors to be the total taxable value of land and additions on the property. | Land | Improvement |
|---|---|---|---|---|
| 2025 | $2,126 | $180,796 | $67,796 | $113,000 |
| 2024 | $2,126 | $177,252 | $66,467 | $110,785 |
| 2023 | $2,077 | $173,777 | $65,164 | $108,613 |
| 2022 | $2,020 | $170,371 | $63,887 | $106,484 |
| 2021 | $2,005 | $167,032 | $62,635 | $104,397 |
| 2020 | $1,980 | $165,320 | $61,993 | $103,327 |
| 2019 | $1,943 | $162,079 | $60,778 | $101,301 |
| 2018 | $1,817 | $158,902 | $59,587 | $99,315 |
| 2017 | $1,772 | $155,787 | $58,419 | $97,368 |
| 2016 | $1,741 | $152,733 | $57,274 | $95,459 |
| 2015 | $1,714 | $150,440 | $56,414 | $94,026 |
| 2014 | $1,687 | $147,494 | $55,309 | $92,185 |
Source: Public Records
Map
Nearby Homes
- 1020 41st St
- 821
- 4264 Market St
- 530 42nd St Unit 1 & 2
- 514 42nd St
- 441-43 Morrison St
- 4225 J St
- 1720 Midvale Dr
- 3688 Cactusview Dr
- 740 Cotton St
- 3665 Ash St Unit 7
- 4216 Posey Place
- 1505 Bridgeview Dr
- 1804 Colonial Ave
- 1480 Bridgeview Dr
- 1742 Rowan St
- 3171 3175 K St
- 441 443 N 41st St
- 348 & 350 27th St
- 0 36th St Unit 4 240028878