4186 N High St Columbus, OH 43214
Clintonville NeighborhoodEstimated Value: $487,525 - $586,000
3
Beds
2
Baths
1,738
Sq Ft
$305/Sq Ft
Est. Value
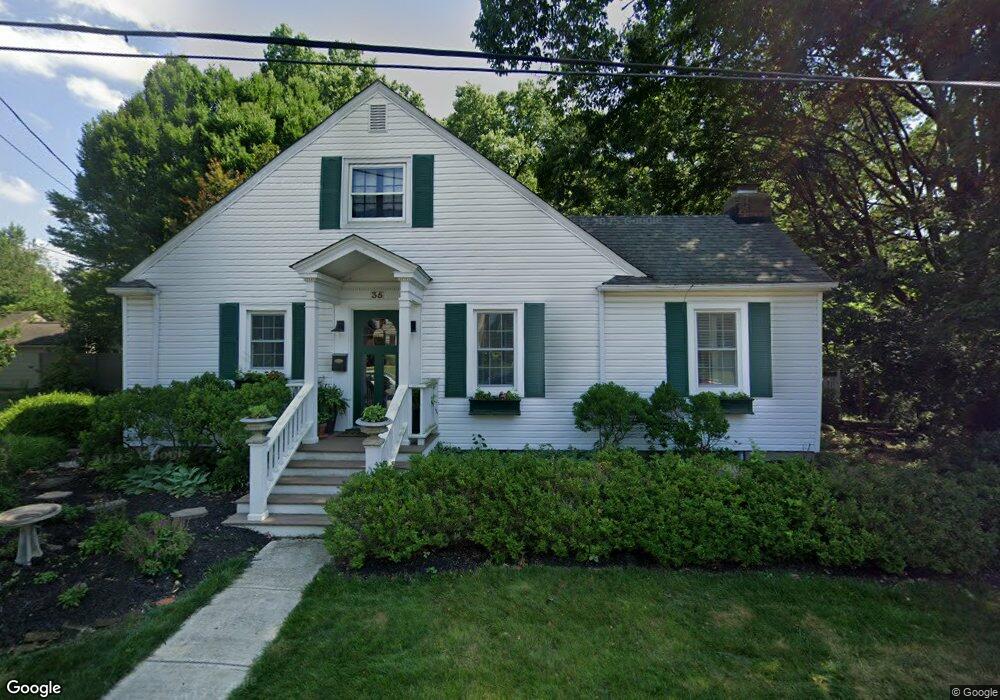
About This Home
This home is located at 4186 N High St, Columbus, OH 43214 and is currently estimated at $529,381, approximately $304 per square foot. 4186 N High St is a home located in Franklin County with nearby schools including Indian Springs Elementary School, Dominion Middle School, and Whetstone High School.
Ownership History
Date
Name
Owned For
Owner Type
Purchase Details
Closed on
Mar 30, 2015
Sold by
Church David W
Bought by
Marshfield Timothy M
Current Estimated Value
Purchase Details
Closed on
Aug 31, 1999
Sold by
Eckholt Michael A and Seeley Donald E
Bought by
Marshfield Timothy M and Church David W
Home Financials for this Owner
Home Financials are based on the most recent Mortgage that was taken out on this home.
Original Mortgage
$202,500
Interest Rate
7.37%
Purchase Details
Closed on
Jul 28, 1999
Sold by
Spall Richard A
Bought by
Eckholt Michael A and Seeley Donald E
Home Financials for this Owner
Home Financials are based on the most recent Mortgage that was taken out on this home.
Original Mortgage
$202,500
Interest Rate
7.37%
Purchase Details
Closed on
Jul 24, 1999
Sold by
Estate Of Elfrieda Colanero
Bought by
Spell Richard A
Home Financials for this Owner
Home Financials are based on the most recent Mortgage that was taken out on this home.
Original Mortgage
$202,500
Interest Rate
7.37%
Purchase Details
Closed on
Aug 21, 1985
Bought by
Colanero Elfrieda
Create a Home Valuation Report for This Property
The Home Valuation Report is an in-depth analysis detailing your home's value as well as a comparison with similar homes in the area
Home Values in the Area
Average Home Value in this Area
Purchase History
| Date | Buyer | Sale Price | Title Company |
|---|---|---|---|
| Marshfield Timothy M | $130,800 | None Available | |
| Marshfield Timothy M | $225,000 | Amerititle Agency Inc | |
| Eckholt Michael A | $135,000 | Amerititle Agency Inc | |
| Spell Richard A | -- | -- | |
| Colanero Elfrieda | -- | -- |
Source: Public Records
Mortgage History
| Date | Status | Borrower | Loan Amount |
|---|---|---|---|
| Previous Owner | Marshfield Timothy M | $202,500 |
Source: Public Records
Tax History Compared to Growth
Tax History
| Year | Tax Paid | Tax Assessment Tax Assessment Total Assessment is a certain percentage of the fair market value that is determined by local assessors to be the total taxable value of land and additions on the property. | Land | Improvement |
|---|---|---|---|---|
| 2024 | $5,489 | $132,100 | $44,070 | $88,030 |
| 2023 | $5,447 | $132,100 | $44,070 | $88,030 |
| 2022 | $5,894 | $122,400 | $31,470 | $90,930 |
| 2021 | $5,905 | $122,400 | $31,470 | $90,930 |
| 2020 | $5,913 | $122,400 | $31,470 | $90,930 |
| 2019 | $6,009 | $107,800 | $25,200 | $82,600 |
| 2018 | $5,487 | $107,800 | $25,200 | $82,600 |
| 2017 | $5,744 | $107,800 | $25,200 | $82,600 |
| 2016 | $5,484 | $91,530 | $21,700 | $69,830 |
| 2015 | $4,978 | $91,530 | $21,700 | $69,830 |
| 2014 | $4,990 | $91,530 | $21,700 | $69,830 |
| 2013 | $2,461 | $91,525 | $21,700 | $69,825 |
Source: Public Records
Map
Nearby Homes
- 197 E Cooke Rd
- 98 Blenheim Rd
- 49 W Henderson Rd
- 148 Deland Ave
- 128 Blenheim Rd
- 340 Canyon Dr S
- 238 W Henderson Rd
- 4466 Olentangy Blvd
- 325 Starrett Ct
- 374 Acton Rd
- 4299 Colerain Ave
- 217 Arden Rd
- 411 Garden Rd
- 4266 Fairoaks Dr
- 541 Northridge Rd
- 685 Yaronia Dr N
- 4193 Eastlea Dr
- 4 W Royal Forest Blvd
- 540 Fallis Rd
- 4000 Indianola Ave
- 35 Indian Springs Dr
- 4170 N High St
- 51 Indian Springs Dr
- 8 Overbrook Dr
- 10 Overbrook Dr
- 38 Indian Springs Dr
- 42 Indian Springs Dr
- 59 Indian Springs Dr
- 10 Indian Springs Dr
- 67 Indian Springs Dr
- 64 Overbrook Dr
- 64 Overbrook Dr
- 68 Overbrook Dr
- 4214 N High St
- 75 Indian Springs Dr
- 72 Overbrook Dr
- 83 Indian Springs Dr
- 4161 N High St
- 4185 N High St
- 4215 N High St