Estimated Value: $702,000 - $881,568
4
Beds
3
Baths
2,811
Sq Ft
$280/Sq Ft
Est. Value
About This Home
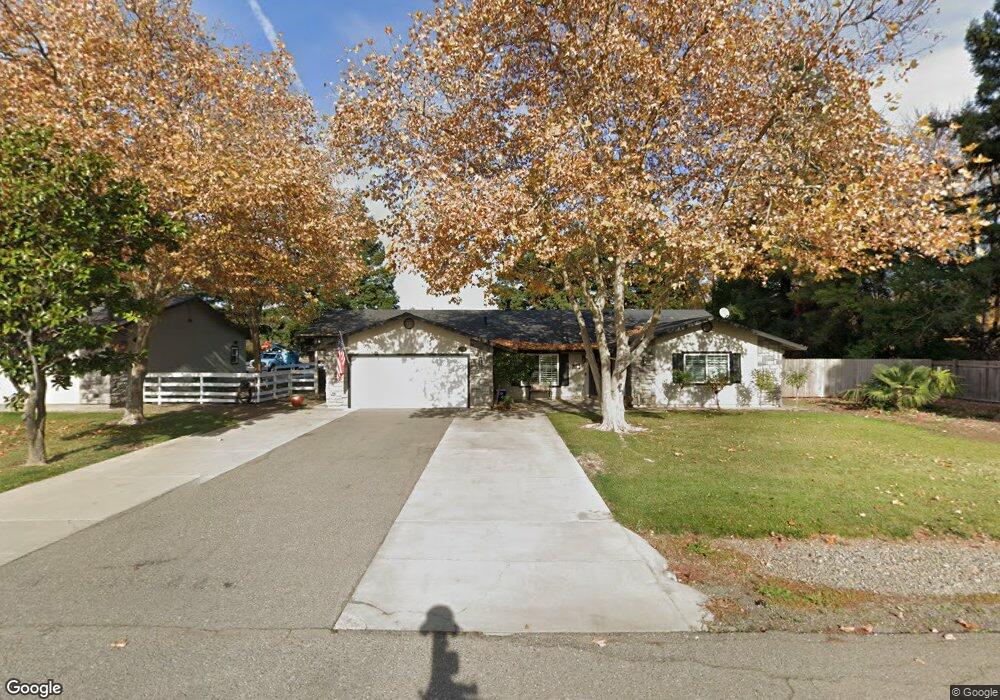
This home is located at 4188 Goldfinch Ct, Chico, CA 95973 and is currently estimated at $786,892, approximately $279 per square foot. 4188 Goldfinch Ct is a home located in Butte County with nearby schools including Shasta Elementary School, Bidwell Junior High School, and Pleasant Valley High School.
Ownership History
Date
Name
Owned For
Owner Type
Purchase Details
Closed on
Jul 13, 2022
Sold by
Garretson Gregory J & Bethany A
Bought by
Gregory J Garretson And Bethany A Garretson R and Garretson
Current Estimated Value
Purchase Details
Closed on
Aug 21, 2002
Sold by
Huber Scott and Huber Kathleen
Bought by
Garretson Gregory James and Garretson Bethany Ann
Home Financials for this Owner
Home Financials are based on the most recent Mortgage that was taken out on this home.
Original Mortgage
$249,375
Interest Rate
6.24%
Purchase Details
Closed on
Sep 11, 1999
Sold by
Rodrigue Christine M
Bought by
Huber William Scott and Huber Kathleen
Home Financials for this Owner
Home Financials are based on the most recent Mortgage that was taken out on this home.
Original Mortgage
$131,600
Interest Rate
8.37%
Create a Home Valuation Report for This Property
The Home Valuation Report is an in-depth analysis detailing your home's value as well as a comparison with similar homes in the area
Home Values in the Area
Average Home Value in this Area
Purchase History
| Date | Buyer | Sale Price | Title Company |
|---|---|---|---|
| Gregory J Garretson And Bethany A Garretson R | -- | None Listed On Document | |
| Garretson Gregory J | -- | None Listed On Document | |
| Garretson Gregory James | $262,500 | Bidwell Title & Escrow Co | |
| Huber William Scott | $164,500 | Mid Valley Title & Escrow Co |
Source: Public Records
Mortgage History
| Date | Status | Borrower | Loan Amount |
|---|---|---|---|
| Previous Owner | Garretson Gregory James | $249,375 | |
| Previous Owner | Huber William Scott | $131,600 | |
| Closed | Huber William Scott | $32,800 |
Source: Public Records
Tax History Compared to Growth
Tax History
| Year | Tax Paid | Tax Assessment Tax Assessment Total Assessment is a certain percentage of the fair market value that is determined by local assessors to be the total taxable value of land and additions on the property. | Land | Improvement |
|---|---|---|---|---|
| 2025 | $6,589 | $595,180 | $181,029 | $414,151 |
| 2024 | $6,589 | $592,687 | $177,480 | $415,207 |
| 2023 | $6,510 | $581,066 | $174,000 | $407,066 |
| 2022 | $5,661 | $503,007 | $170,589 | $332,418 |
| 2021 | $5,555 | $493,145 | $167,245 | $325,900 |
| 2020 | $5,539 | $488,090 | $165,531 | $322,559 |
| 2019 | $5,417 | $478,521 | $162,286 | $316,235 |
| 2018 | $5,340 | $469,139 | $159,104 | $310,035 |
| 2017 | $5,225 | $459,941 | $155,985 | $303,956 |
| 2016 | $4,776 | $450,924 | $152,927 | $297,997 |
| 2015 | $4,746 | $444,151 | $150,630 | $293,521 |
| 2014 | $4,295 | $405,000 | $165,000 | $240,000 |
Source: Public Records
Map
Nearby Homes
- 4269 Keith Ln
- 4298 Keith Ln
- 4301 Stable Ln
- 0 Garner Ln
- 63 Our Way
- 13951 Caribbean Way
- 13962 Lindbergh Cir
- 3549 Esplanade Unit 402
- 14034 Limousin Dr
- 55 Roseanna Ct
- 351 Bainbridge Place
- 10 Roseanna Ct
- 305 Bellamy Terrace
- 263 Camino Norte St Unit 212
- 3452 Sloat Run
- 3428 Penzance Ave
- 3549 Vía Medio Unit 178
- 385 Bellamy Terrace
- 3445 Chamberlain Run
- 3555 Calle Principal Unit 87
- 4172 Goldfinch Ct
- 4187 Goldfinch Ct
- 4173 Goldfinch Ct
- 13581 Garner Ln
- 13593 Garner Ln
- 13573 Garner Ln
- 13601 Garner Ln
- 4189 Spyglass Rd
- 13609 Garner Ln
- 4215 Keith Ln
- 4218 Keith Ln
- 4175 Spyglass Rd
- 4199 Spyglass Rd
- 4154 Goldfinch Ct
- 4223 Keith Ln
- 4153 Goldfinch Ct
- 4211 Michelle Ct
- 13546 Garner Ln
- 4226 Keith Ln
- 4165 Spyglass Rd