4189 Julian St Denver, CO 80211
Berkeley NeighborhoodEstimated Value: $730,524 - $758,000
3
Beds
1
Bath
1,541
Sq Ft
$485/Sq Ft
Est. Value
About This Home
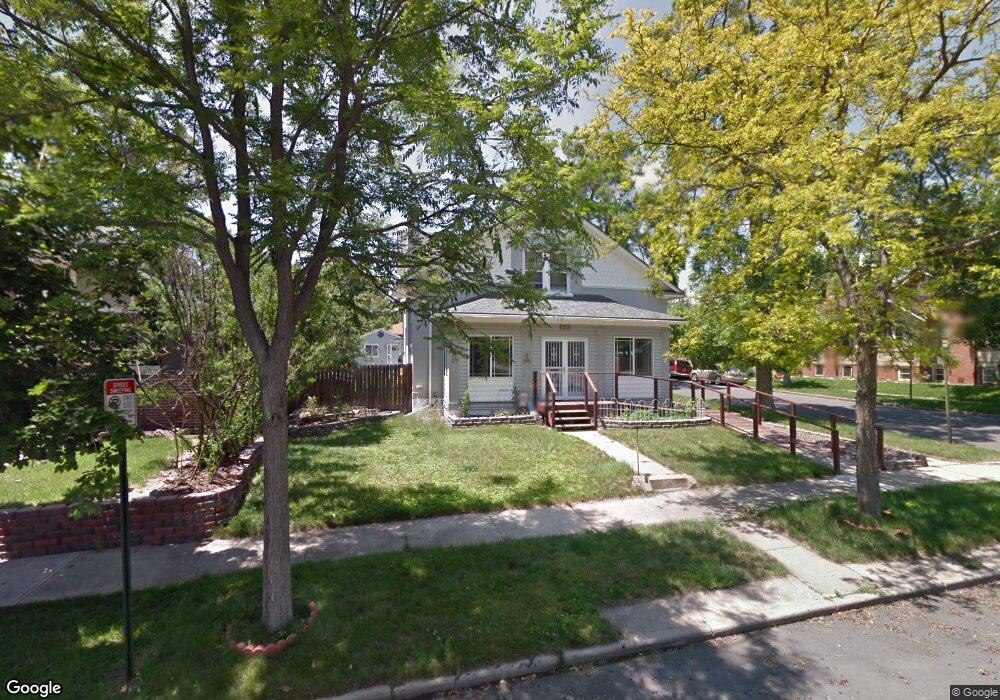
This home is located at 4189 Julian St, Denver, CO 80211 and is currently estimated at $747,131, approximately $484 per square foot. 4189 Julian St is a home located in Denver County with nearby schools including Bryant Webster Dual Language School, Skinner Middle School, and Denver Montessori Junior/Senior High School.
Ownership History
Date
Name
Owned For
Owner Type
Purchase Details
Closed on
Sep 14, 2021
Sold by
Dennis Freda K and The Dennis Family Trust
Bought by
Dennis Freda and The Dennis Family Trust
Current Estimated Value
Purchase Details
Closed on
Jan 28, 2015
Sold by
Dennis Donald L and Dennis Freda K
Bought by
Dennis Family Trust
Create a Home Valuation Report for This Property
The Home Valuation Report is an in-depth analysis detailing your home's value as well as a comparison with similar homes in the area
Home Values in the Area
Average Home Value in this Area
Purchase History
| Date | Buyer | Sale Price | Title Company |
|---|---|---|---|
| Dennis Freda | -- | Fnc Title Services Llc | |
| Dennis Family Trust | -- | None Available |
Source: Public Records
Tax History Compared to Growth
Tax History
| Year | Tax Paid | Tax Assessment Tax Assessment Total Assessment is a certain percentage of the fair market value that is determined by local assessors to be the total taxable value of land and additions on the property. | Land | Improvement |
|---|---|---|---|---|
| 2024 | $3,139 | $46,330 | $25,610 | $20,720 |
| 2023 | $3,071 | $46,330 | $25,610 | $20,720 |
| 2022 | $2,449 | $37,740 | $29,300 | $8,440 |
| 2021 | $2,364 | $38,830 | $30,140 | $8,690 |
| 2020 | $2,231 | $37,220 | $30,140 | $7,080 |
| 2019 | $2,169 | $37,220 | $30,140 | $7,080 |
| 2018 | $1,897 | $31,720 | $22,490 | $9,230 |
| 2017 | $1,891 | $31,720 | $22,490 | $9,230 |
| 2016 | $1,744 | $29,350 | $21,134 | $8,216 |
| 2015 | $1,671 | $29,350 | $21,134 | $8,216 |
| 2014 | $1,527 | $26,350 | $9,942 | $16,408 |
Source: Public Records
Map
Nearby Homes
- 4169 Hooker St
- 4000 Irving St
- 3428 W 45th Ave
- 4047 Lowell Blvd
- 4446 Lowell Blvd
- 3119 W 44th Ave
- 4267 Federal Blvd
- 3812 Julian St
- 4570 Irving St
- 3356 W 46th Ave
- 3037 W 39th Ave
- 3035 W 39th Ave
- 3360 W 38th Ave Unit West10
- 4511 Federal Blvd
- 3039 W Denver Place
- 3130 W 38th Ave Unit 4
- 4253 Perry St
- 4325 Perry St
- 4405 Perry St
- 3790 Newton St