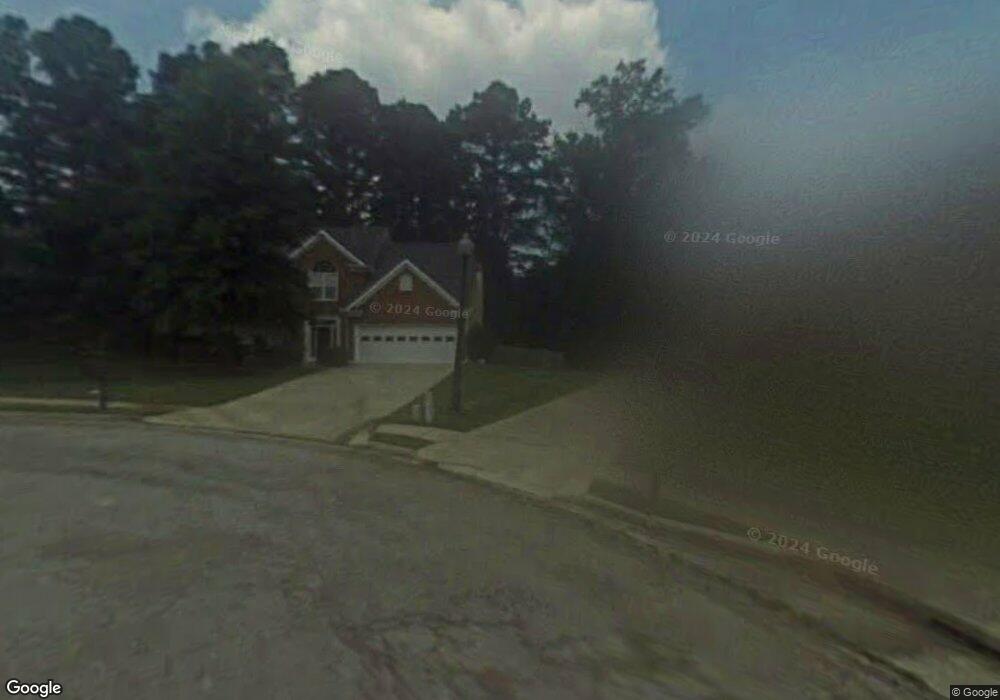
4189 Roberts Cove Terrace Unit 2 Suwanee, GA 30024
Estimated Value: $547,662 - $608,000
4
Beds
3
Baths
2,281
Sq Ft
$249/Sq Ft
Est. Value
About This Home
This home is located at 4189 Roberts Cove Terrace Unit 2, Suwanee, GA 30024 and is currently estimated at $568,416, approximately $249 per square foot. 4189 Roberts Cove Terrace Unit 2 is a home located in Gwinnett County with nearby schools including Roberts Elementary School, North Gwinnett Middle School, and North Gwinnett High School.
Ownership History
Date
Name
Owned For
Owner Type
Purchase Details
Closed on
May 23, 2002
Sold by
Billington David and Billington Cathy
Bought by
Yeager Anthony D
Current Estimated Value
Home Financials for this Owner
Home Financials are based on the most recent Mortgage that was taken out on this home.
Original Mortgage
$164,700
Interest Rate
6.77%
Mortgage Type
New Conventional
Purchase Details
Closed on
Apr 28, 1998
Sold by
Brown John E and Brown Annette
Bought by
Fricks Thomas B and Fricks Amy J
Home Financials for this Owner
Home Financials are based on the most recent Mortgage that was taken out on this home.
Original Mortgage
$160,450
Interest Rate
7.11%
Mortgage Type
New Conventional
Purchase Details
Closed on
Aug 2, 1996
Sold by
Epic Const Coco Inc
Bought by
Brown John Annette
Create a Home Valuation Report for This Property
The Home Valuation Report is an in-depth analysis detailing your home's value as well as a comparison with similar homes in the area
Home Values in the Area
Average Home Value in this Area
Purchase History
| Date | Buyer | Sale Price | Title Company |
|---|---|---|---|
| Yeager Anthony D | $205,900 | -- | |
| Fricks Thomas B | $168,900 | -- | |
| Brown John Annette | $165,200 | -- |
Source: Public Records
Mortgage History
| Date | Status | Borrower | Loan Amount |
|---|---|---|---|
| Closed | Yeager Anthony D | $164,700 | |
| Previous Owner | Fricks Thomas B | $160,450 | |
| Closed | Brown John Annette | $0 |
Source: Public Records
Tax History Compared to Growth
Tax History
| Year | Tax Paid | Tax Assessment Tax Assessment Total Assessment is a certain percentage of the fair market value that is determined by local assessors to be the total taxable value of land and additions on the property. | Land | Improvement |
|---|---|---|---|---|
| 2025 | -- | $181,600 | $38,000 | $143,600 |
| 2024 | -- | $192,240 | $40,000 | $152,240 |
| 2023 | $3,922 | $181,680 | $40,000 | $141,680 |
| 2022 | $4,697 | $154,400 | $37,600 | $116,800 |
| 2021 | $3,638 | $113,440 | $24,920 | $88,520 |
| 2020 | $3,666 | $113,440 | $24,920 | $88,520 |
| 2019 | $3,101 | $113,440 | $24,920 | $88,520 |
| 2018 | $3,117 | $113,440 | $24,920 | $88,520 |
| 2016 | $2,739 | $95,920 | $27,600 | $68,320 |
| 2015 | $2,687 | $92,160 | $23,600 | $68,560 |
| 2014 | $2,605 | $87,680 | $21,200 | $66,480 |
Source: Public Records
Map
Nearby Homes
- 297 Dogwood View Ln
- 270 Dogwood View Ct
- 374 Creek Manor Way
- 384 Creek Manor Way
- 235 Ruby Forest Pkwy
- 225 Ruby Forest Pkwy
- 4045 Hillcrest View Ct
- 105 Treemont Trace
- 4186 Terrace Oaks Ct
- 4273 Winslow Hill Ct
- 4394 Austin Hills Dr Unit 1
- 4244 Austin Hills Dr
- 4275 Westbrook Rd
- 4614 Austin Hills Dr
- 4080 Cherry Ridge Walk Unit 1
- 366 Regal Pines Ct
- 358 Rhodes House Ct
- 4094 Dollar Cir Unit 2
- 3713 Lake Edge Dr
- 4179 Roberts Cove Terrace Unit 2
- 235 Roberts Rd
- 4182 Roberts Cove Terrace
- 282 Dogwood View Ln
- 245 Roberts Rd Unit 2
- 255 Roberts Rd
- 272 Dogwood View Ln Unit V
- 4103 Roberts Cove Terrace
- 4164 Roberts Cove Terrace
- 4210 Ruby Forest Blvd
- 0 Roberts Rd Unit 8684102
- 0 Roberts Rd Unit 8453091
- 0 Roberts Rd Unit 8396265
- 0 Roberts Rd Unit 8827725
- 0 Roberts Rd Unit 8855548
- 4174 Roberts Cove Terrace
- 4200 Ruby Forest Blvd Unit 5
- 240 Roberts Rd Unit 2
- 230 Roberts Rd Unit 2
- 4184 Roberts Cove Terrace Unit 2