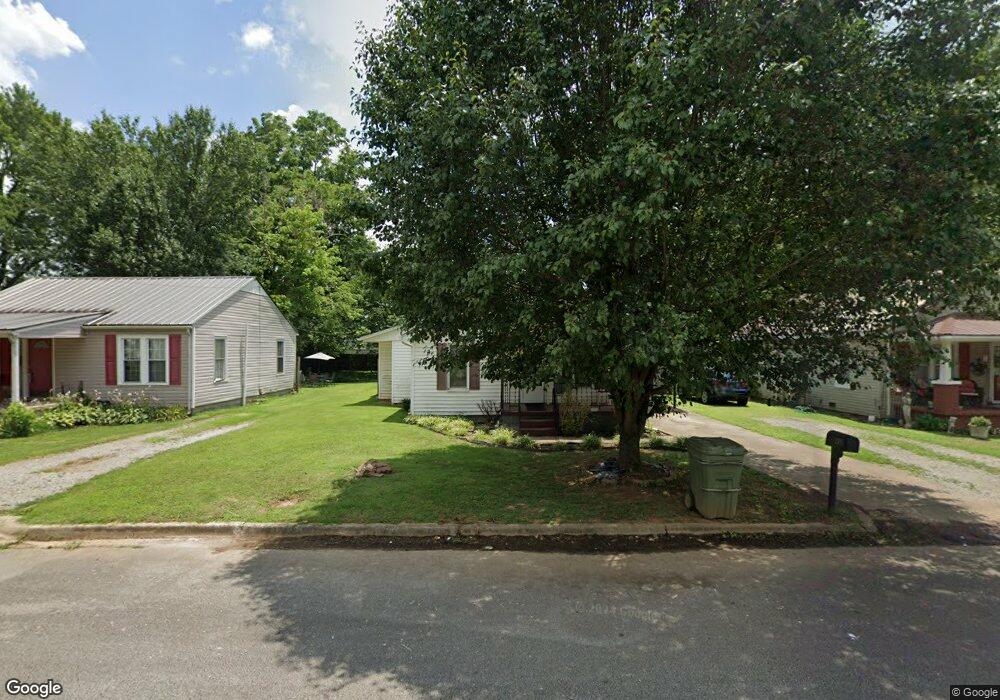
419 1st St Lawrenceburg, TN 38464
Estimated Value: $97,963 - $162,000
--
Bed
1
Bath
891
Sq Ft
$149/Sq Ft
Est. Value
About This Home
This home is located at 419 1st St, Lawrenceburg, TN 38464 and is currently estimated at $132,491, approximately $148 per square foot. 419 1st St is a home located in Lawrence County with nearby schools including Ingram Sowell Elementary School, Lawrenceburg Public Elementary School, and David Crockett Elementary School.
Ownership History
Date
Name
Owned For
Owner Type
Purchase Details
Closed on
Jul 5, 2006
Sold by
Lynn Phillips Andrea
Bought by
Martha Bumpas
Current Estimated Value
Home Financials for this Owner
Home Financials are based on the most recent Mortgage that was taken out on this home.
Original Mortgage
$59,000
Outstanding Balance
$40,006
Interest Rate
9.5%
Estimated Equity
$92,485
Purchase Details
Closed on
May 28, 2005
Bought by
Phillips Andrea Lynn and Phillips Jessie L
Purchase Details
Closed on
Sep 19, 2002
Sold by
Smith Roy W and Smith Jewell M
Bought by
Lynn Philips Andrea
Home Financials for this Owner
Home Financials are based on the most recent Mortgage that was taken out on this home.
Original Mortgage
$17,500
Interest Rate
6.19%
Purchase Details
Closed on
Oct 22, 1999
Sold by
Shaw M M
Bought by
Smith Roy W and Smith Jewell M
Purchase Details
Closed on
Aug 18, 1999
Bought by
Smith Roy W and Smith Jewell M
Create a Home Valuation Report for This Property
The Home Valuation Report is an in-depth analysis detailing your home's value as well as a comparison with similar homes in the area
Home Values in the Area
Average Home Value in this Area
Purchase History
| Date | Buyer | Sale Price | Title Company |
|---|---|---|---|
| Martha Bumpas | $59,000 | -- | |
| Phillips Andrea Lynn | -- | -- | |
| Lynn Philips Andrea | $40,000 | -- | |
| Smith Roy W | $34,500 | -- | |
| Smith Roy W | $34,500 | -- |
Source: Public Records
Mortgage History
| Date | Status | Borrower | Loan Amount |
|---|---|---|---|
| Open | Smith Roy W | $59,000 | |
| Previous Owner | Smith Roy W | $17,500 |
Source: Public Records
Tax History Compared to Growth
Tax History
| Year | Tax Paid | Tax Assessment Tax Assessment Total Assessment is a certain percentage of the fair market value that is determined by local assessors to be the total taxable value of land and additions on the property. | Land | Improvement |
|---|---|---|---|---|
| 2025 | $541 | $17,400 | $0 | $0 |
| 2024 | $541 | $17,400 | $1,500 | $15,900 |
| 2023 | $541 | $17,400 | $1,500 | $15,900 |
| 2022 | $541 | $17,400 | $1,500 | $15,900 |
| 2021 | $477 | $10,850 | $1,500 | $9,350 |
| 2020 | $477 | $10,850 | $1,500 | $9,350 |
| 2019 | $477 | $10,850 | $1,500 | $9,350 |
| 2018 | $477 | $10,850 | $1,500 | $9,350 |
| 2017 | $477 | $10,850 | $1,500 | $9,350 |
| 2016 | $477 | $10,850 | $1,500 | $9,350 |
| 2015 | $452 | $10,850 | $1,500 | $9,350 |
| 2014 | $443 | $10,650 | $1,500 | $9,150 |
Source: Public Records
Map
Nearby Homes