Estimated Value: $1,819,000 - $2,702,000
3
Beds
5
Baths
2,756
Sq Ft
$841/Sq Ft
Est. Value
About This Home
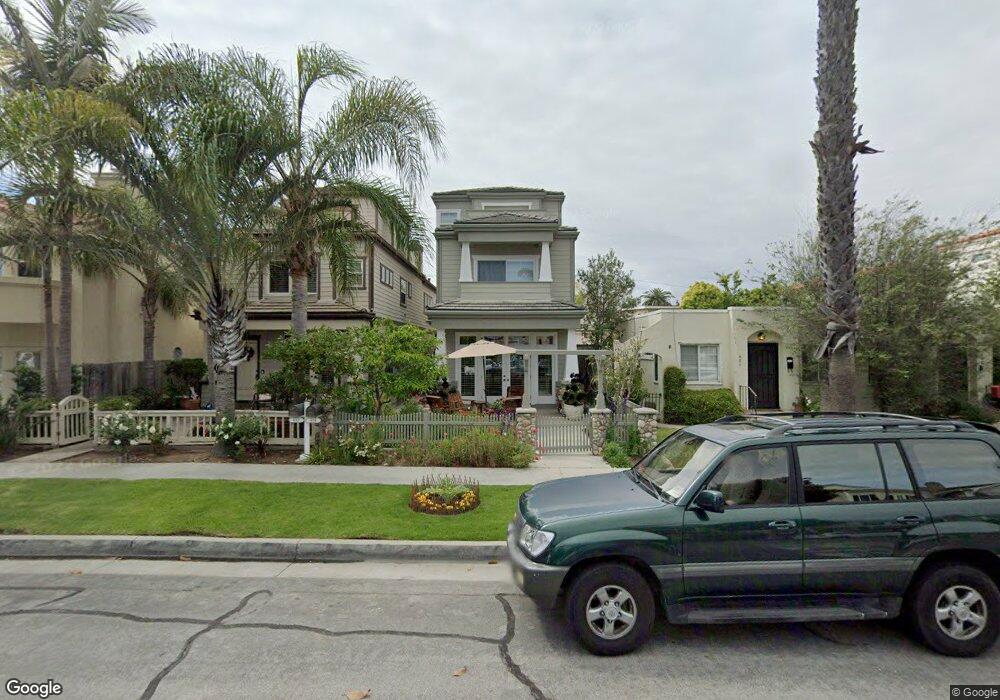
This home is located at 419 9th St, Huntington Beach, CA 92648 and is currently estimated at $2,316,611, approximately $840 per square foot. 419 9th St is a home located in Orange County with nearby schools including Agnes L. Smith Elementary, Ethel Dwyer Middle, and Huntington Beach High School.
Ownership History
Date
Name
Owned For
Owner Type
Purchase Details
Closed on
Feb 13, 2013
Sold by
Lown Margaret E
Bought by
Lown Margaret Eaton and The Margaret Eaton Lown Revocable Trust
Current Estimated Value
Purchase Details
Closed on
Aug 6, 2001
Sold by
Lown John M and Lown Margaret E
Bought by
Scognamillo Frank and Scognamillo Ellen
Purchase Details
Closed on
Jan 26, 2001
Sold by
Lown John M and Lown Margaret E
Bought by
Lown John M and Lown Margaret E
Home Financials for this Owner
Home Financials are based on the most recent Mortgage that was taken out on this home.
Original Mortgage
$860,000
Interest Rate
7.41%
Purchase Details
Closed on
Jun 1, 1999
Sold by
Milligan Darlene
Bought by
Lown John M and Lown Margaret E
Home Financials for this Owner
Home Financials are based on the most recent Mortgage that was taken out on this home.
Original Mortgage
$330,000
Interest Rate
7.37%
Create a Home Valuation Report for This Property
The Home Valuation Report is an in-depth analysis detailing your home's value as well as a comparison with similar homes in the area
Home Values in the Area
Average Home Value in this Area
Purchase History
| Date | Buyer | Sale Price | Title Company |
|---|---|---|---|
| Lown Margaret Eaton | -- | None Available | |
| Lown Margaret E | -- | None Available | |
| Lown John M | -- | None Available | |
| Scognamillo Frank | $675,000 | Orange Coast Title | |
| Lown John M | -- | Lawyers Title Company | |
| Lown John M | $480,000 | North American Title |
Source: Public Records
Mortgage History
| Date | Status | Borrower | Loan Amount |
|---|---|---|---|
| Previous Owner | Lown John M | $860,000 | |
| Previous Owner | Lown John M | $330,000 |
Source: Public Records
Tax History Compared to Growth
Tax History
| Year | Tax Paid | Tax Assessment Tax Assessment Total Assessment is a certain percentage of the fair market value that is determined by local assessors to be the total taxable value of land and additions on the property. | Land | Improvement |
|---|---|---|---|---|
| 2025 | $7,824 | $694,665 | $346,922 | $347,743 |
| 2024 | $7,824 | $681,045 | $340,120 | $340,925 |
| 2023 | $7,647 | $667,692 | $333,451 | $334,241 |
| 2022 | $7,446 | $654,600 | $326,912 | $327,688 |
| 2021 | $7,306 | $641,765 | $320,502 | $321,263 |
| 2020 | $7,258 | $635,185 | $317,216 | $317,969 |
| 2019 | $7,171 | $622,731 | $310,996 | $311,735 |
| 2018 | $7,059 | $610,521 | $304,898 | $305,623 |
| 2017 | $6,964 | $598,550 | $298,919 | $299,631 |
| 2016 | $6,655 | $586,814 | $293,058 | $293,756 |
| 2015 | $6,590 | $578,000 | $288,656 | $289,344 |
| 2014 | $6,452 | $566,678 | $283,001 | $283,677 |
Source: Public Records
Map
Nearby Homes
- 427 10th St
- 309 8th St
- 221 10th St
- 1111 Olive Ave Unit A & B
- 228 12th St Unit 1113 Olive Av
- 526 12th St
- 116 11th St
- 621 8th St
- 513 Pecan Ave
- 521 12th St
- 316 6th St
- 1102 Pacific Coast Hwy Unit Lot 4
- 1200 Pacific Coast Hwy Unit 102
- 1200 Pacific Coast Hwy
- 1200 Pacific Coast Hwy Unit 214
- 517 Walnut Ave
- 308 5th St
- 413 14th St Unit D
- 319 14th St Unit B
- 613 13th St