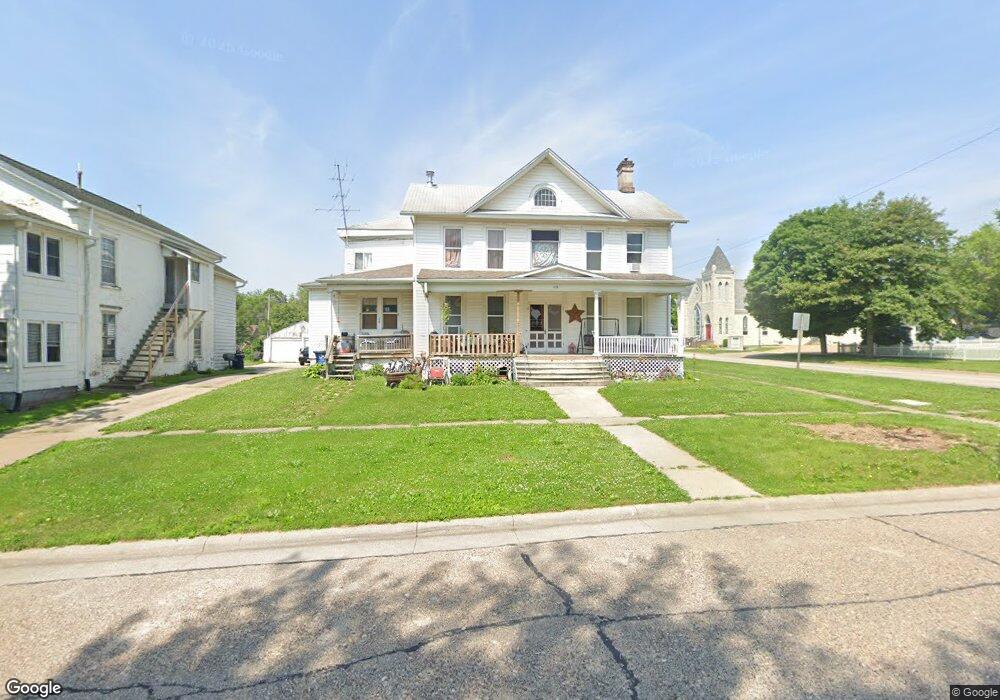
419 Cedar St Wilton, IA 52778
Estimated Value: $198,000 - $206,259
4
Beds
3
Baths
2,616
Sq Ft
$77/Sq Ft
Est. Value
About This Home
This home is located at 419 Cedar St, Wilton, IA 52778 and is currently estimated at $201,065, approximately $76 per square foot. 419 Cedar St is a home located in Muscatine County with nearby schools including Wilton Elementary School and Wilton Junior/Senior High School.
Ownership History
Date
Name
Owned For
Owner Type
Purchase Details
Closed on
Dec 23, 2021
Sold by
Basulto Properties Llc
Bought by
New Era Holdings Llc
Current Estimated Value
Home Financials for this Owner
Home Financials are based on the most recent Mortgage that was taken out on this home.
Original Mortgage
$150,000
Outstanding Balance
$133,964
Interest Rate
2.98%
Mortgage Type
Future Advance Clause Open End Mortgage
Estimated Equity
$67,101
Purchase Details
Closed on
Jan 29, 2016
Sold by
Shontz Ward W and Shontz Judy M
Bought by
Basulto Prooperties Llc
Create a Home Valuation Report for This Property
The Home Valuation Report is an in-depth analysis detailing your home's value as well as a comparison with similar homes in the area
Home Values in the Area
Average Home Value in this Area
Purchase History
| Date | Buyer | Sale Price | Title Company |
|---|---|---|---|
| New Era Holdings Llc | $175,000 | None Available | |
| Basulto Prooperties Llc | $78,937 | None Available |
Source: Public Records
Mortgage History
| Date | Status | Borrower | Loan Amount |
|---|---|---|---|
| Open | New Era Holdings Llc | $150,000 |
Source: Public Records
Tax History
| Year | Tax Paid | Tax Assessment Tax Assessment Total Assessment is a certain percentage of the fair market value that is determined by local assessors to be the total taxable value of land and additions on the property. | Land | Improvement |
|---|---|---|---|---|
| 2025 | $3,390 | $198,960 | $21,920 | $177,040 |
| 2024 | $3,390 | $196,160 | $21,920 | $174,240 |
| 2023 | $3,172 | $192,474 | $21,931 | $170,543 |
| 2022 | $2,572 | $170,520 | $20,690 | $149,830 |
| 2021 | $2,572 | $110,870 | $20,690 | $90,180 |
| 2020 | $2,426 | $89,740 | $8,580 | $81,160 |
| 2019 | $2,504 | $0 | $0 | $0 |
| 2018 | $2,590 | $0 | $0 | $0 |
| 2017 | $2,810 | $89,330 | $0 | $0 |
| 2016 | $2,960 | $89,330 | $0 | $0 |
| 2015 | $2,960 | $83,730 | $0 | $0 |
| 2014 | $2,902 | $83,730 | $0 | $0 |
Source: Public Records
Map
Nearby Homes
Your Personal Tour Guide
Ask me questions while you tour the home.