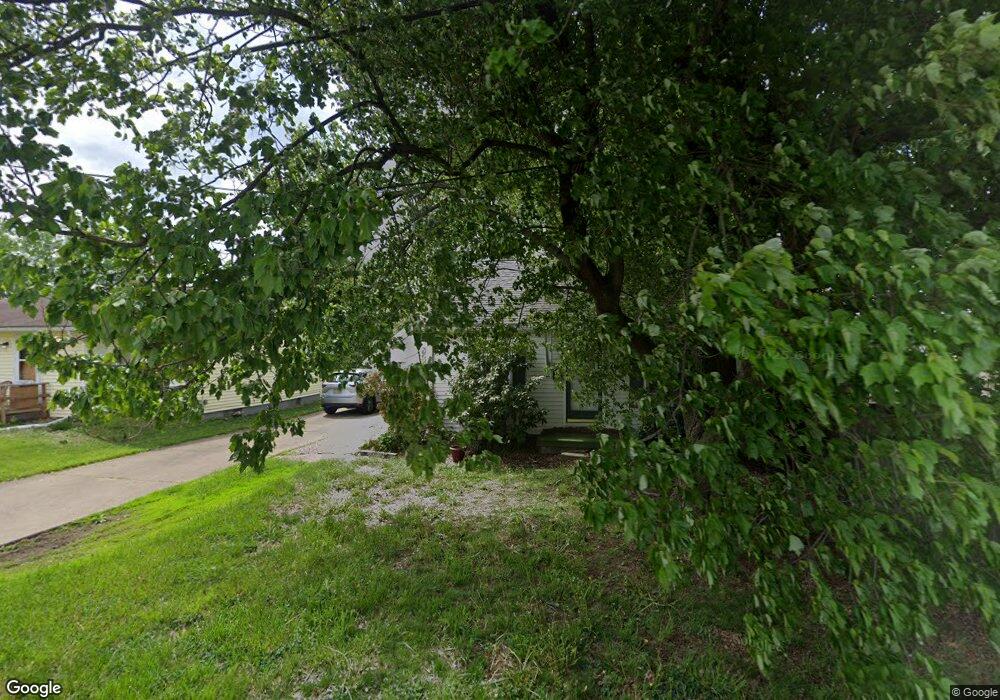
419 Coe Ave Coshocton, OH 43812
Estimated Value: $67,000 - $135,000
2
Beds
1
Bath
622
Sq Ft
$164/Sq Ft
Est. Value
About This Home
This home is located at 419 Coe Ave, Coshocton, OH 43812 and is currently estimated at $102,159, approximately $164 per square foot. 419 Coe Ave is a home located in Coshocton County with nearby schools including Coshocton High School, Coshocton Opportunity School, and Sacred Heart School.
Ownership History
Date
Name
Owned For
Owner Type
Purchase Details
Closed on
Aug 31, 2016
Sold by
Csbt Llc
Bought by
Moore Nathan K and Moore Heather D
Current Estimated Value
Home Financials for this Owner
Home Financials are based on the most recent Mortgage that was taken out on this home.
Original Mortgage
$39,600
Outstanding Balance
$31,651
Interest Rate
3.45%
Mortgage Type
Future Advance Clause Open End Mortgage
Estimated Equity
$70,508
Purchase Details
Closed on
Dec 29, 1997
Sold by
Bechtol Fern
Bought by
Taylor Deborah J
Create a Home Valuation Report for This Property
The Home Valuation Report is an in-depth analysis detailing your home's value as well as a comparison with similar homes in the area
Home Values in the Area
Average Home Value in this Area
Purchase History
| Date | Buyer | Sale Price | Title Company |
|---|---|---|---|
| Moore Nathan K | $38,000 | None Available | |
| Taylor Deborah J | -- | -- |
Source: Public Records
Mortgage History
| Date | Status | Borrower | Loan Amount |
|---|---|---|---|
| Open | Moore Nathan K | $39,600 |
Source: Public Records
Tax History
| Year | Tax Paid | Tax Assessment Tax Assessment Total Assessment is a certain percentage of the fair market value that is determined by local assessors to be the total taxable value of land and additions on the property. | Land | Improvement |
|---|---|---|---|---|
| 2024 | $652 | $15,440 | $4,280 | $11,160 |
| 2023 | $652 | $12,117 | $3,297 | $8,820 |
| 2022 | $595 | $12,117 | $3,297 | $8,820 |
| 2021 | $596 | $12,117 | $3,297 | $8,820 |
| 2020 | $589 | $11,593 | $3,210 | $8,383 |
| 2019 | $595 | $11,593 | $3,210 | $8,383 |
| 2018 | $588 | $11,593 | $3,210 | $8,383 |
| 2017 | $598 | $11,316 | $2,996 | $8,320 |
| 2016 | $575 | $11,316 | $2,996 | $8,320 |
| 2015 | $289 | $11,316 | $2,996 | $8,320 |
| 2014 | $536 | $11,572 | $3,994 | $7,578 |
Source: Public Records
Map
Nearby Homes
Your Personal Tour Guide
Ask me questions while you tour the home.