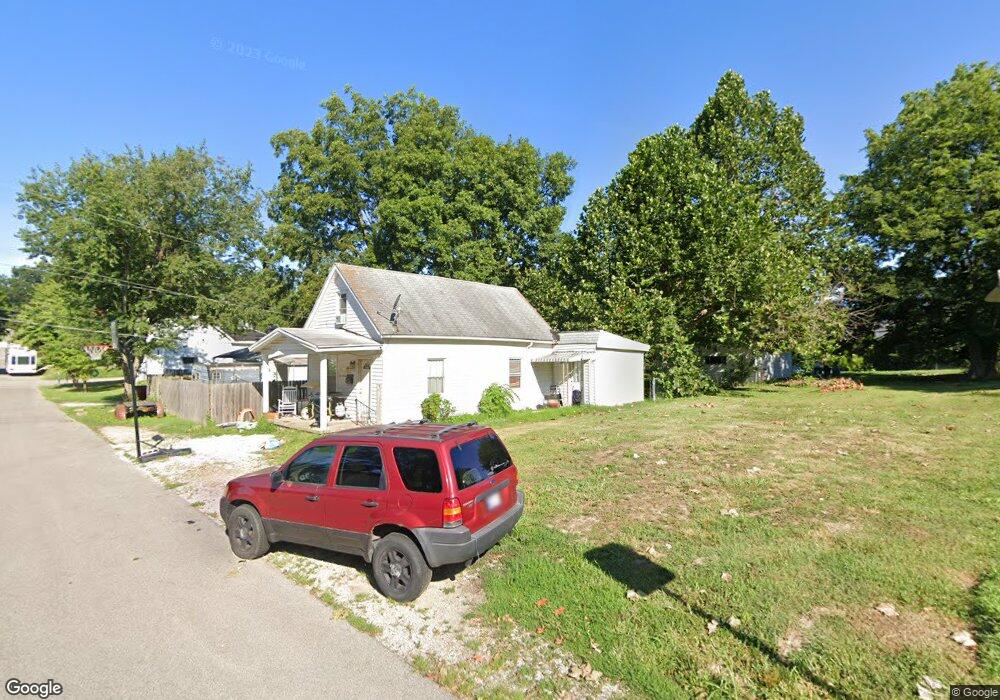
419 E 9th St Mount Vernon, IN 47620
Estimated Value: $100,000 - $132,000
3
Beds
1
Bath
1,358
Sq Ft
$89/Sq Ft
Est. Value
About This Home
This home is located at 419 E 9th St, Mount Vernon, IN 47620 and is currently estimated at $121,326, approximately $89 per square foot. 419 E 9th St is a home located in Posey County with nearby schools including Mount Vernon Junior High School, Mount Vernon High School, and St. Matthew Elementary School.
Ownership History
Date
Name
Owned For
Owner Type
Purchase Details
Closed on
Mar 9, 2016
Sold by
Davis James F and Davis Laird D
Bought by
Poole John and Poole Sherry L
Current Estimated Value
Purchase Details
Closed on
Jun 10, 2009
Sold by
Davis James F and Davis Laird D
Bought by
Poole John and Poole Sherry L
Home Financials for this Owner
Home Financials are based on the most recent Mortgage that was taken out on this home.
Original Mortgage
$10,000
Interest Rate
4%
Mortgage Type
Seller Take Back
Purchase Details
Closed on
Aug 23, 2005
Sold by
Saltzman Jerome R and Saltzman Sharon K
Bought by
Moore Dennis W and Moore Rhonda C
Create a Home Valuation Report for This Property
The Home Valuation Report is an in-depth analysis detailing your home's value as well as a comparison with similar homes in the area
Home Values in the Area
Average Home Value in this Area
Purchase History
| Date | Buyer | Sale Price | Title Company |
|---|---|---|---|
| Poole John | -- | None Available | |
| Poole John | $42,000 | None Available | |
| Moore Dennis W | -- | None Available |
Source: Public Records
Mortgage History
| Date | Status | Borrower | Loan Amount |
|---|---|---|---|
| Previous Owner | Poole John | $10,000 |
Source: Public Records
Tax History Compared to Growth
Tax History
| Year | Tax Paid | Tax Assessment Tax Assessment Total Assessment is a certain percentage of the fair market value that is determined by local assessors to be the total taxable value of land and additions on the property. | Land | Improvement |
|---|---|---|---|---|
| 2024 | $625 | $55,800 | $6,700 | $49,100 |
| 2023 | -- | $48,900 | $6,700 | $42,200 |
| 2022 | $0 | $46,300 | $6,700 | $39,600 |
| 2021 | $11 | $41,900 | $6,700 | $35,200 |
| 2020 | $11 | $49,200 | $6,500 | $42,700 |
| 2019 | $5 | $48,500 | $6,500 | $42,000 |
| 2018 | $0 | $46,800 | $6,500 | $40,300 |
| 2017 | $0 | $45,500 | $6,700 | $38,800 |
| 2016 | -- | $45,900 | $6,700 | $39,200 |
| 2014 | -- | $49,000 | $6,700 | $42,300 |
| 2013 | -- | $51,700 | $7,000 | $44,700 |
Source: Public Records
Map
Nearby Homes