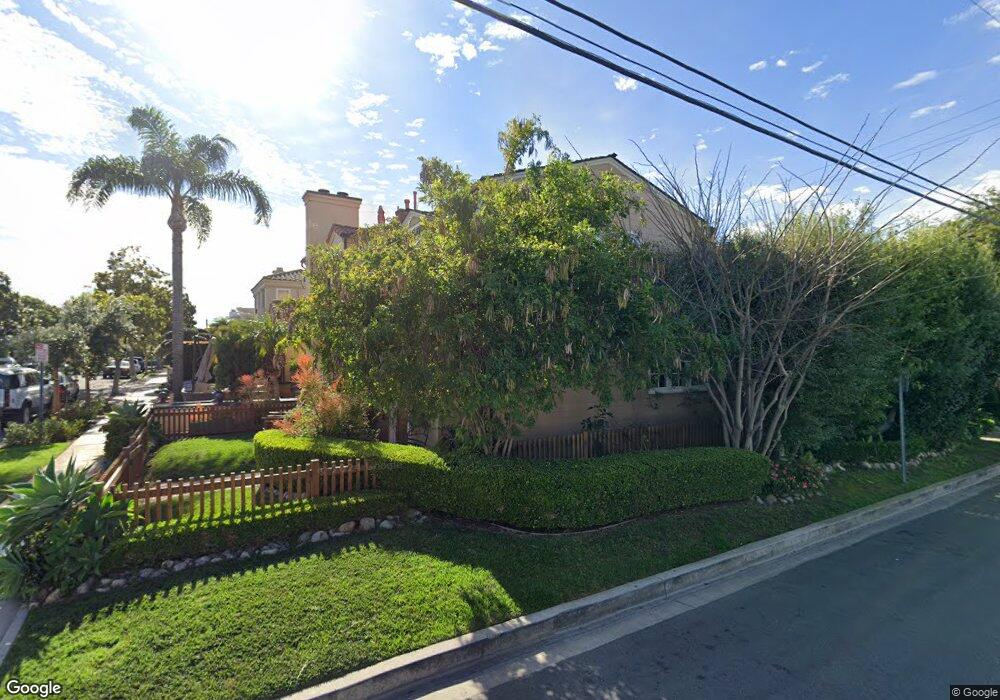
419 Fernleaf Ave Corona Del Mar, CA 92625
Corona Del Mar NeighborhoodEstimated Value: $2,477,923 - $3,547,000
2
Beds
2
Baths
706
Sq Ft
$4,369/Sq Ft
Est. Value
About This Home
This home is located at 419 Fernleaf Ave, Corona Del Mar, CA 92625 and is currently estimated at $3,084,231, approximately $4,368 per square foot. 419 Fernleaf Ave is a home located in Orange County with nearby schools including Harbor View Elementary School, Corona del Mar Middle and High School, and Harbor Day School.
Ownership History
Date
Name
Owned For
Owner Type
Purchase Details
Closed on
Jun 19, 2023
Sold by
Pion Richard and Pion Dawn
Bought by
Pion Family Trust
Current Estimated Value
Purchase Details
Closed on
Apr 19, 2005
Sold by
Zager Gary and Zager Christina D
Bought by
Zager Gary and Zager Christina D
Purchase Details
Closed on
Dec 10, 2002
Sold by
Zager Gary and Zager Christina D
Bought by
Zager Gary and Zager Christina D
Home Financials for this Owner
Home Financials are based on the most recent Mortgage that was taken out on this home.
Original Mortgage
$384,000
Interest Rate
6.03%
Mortgage Type
Purchase Money Mortgage
Purchase Details
Closed on
May 21, 2001
Sold by
Zager Gary and Zager Christina D
Bought by
Zager Gary and Zager Christina D
Home Financials for this Owner
Home Financials are based on the most recent Mortgage that was taken out on this home.
Original Mortgage
$225,000
Interest Rate
7.14%
Mortgage Type
Purchase Money Mortgage
Purchase Details
Closed on
Aug 7, 2000
Sold by
Pion Richard W and Pion Dawn M
Bought by
Pion Richard W and Pion Dawn M
Create a Home Valuation Report for This Property
The Home Valuation Report is an in-depth analysis detailing your home's value as well as a comparison with similar homes in the area
Home Values in the Area
Average Home Value in this Area
Purchase History
| Date | Buyer | Sale Price | Title Company |
|---|---|---|---|
| Pion Family Trust | -- | None Listed On Document | |
| Zager Gary | -- | -- | |
| Zager Gary | -- | Southland Title | |
| Zager Gary | -- | First American Title Ins Co | |
| Pion Richard W | -- | -- |
Source: Public Records
Mortgage History
| Date | Status | Borrower | Loan Amount |
|---|---|---|---|
| Previous Owner | Zager Gary | $384,000 | |
| Previous Owner | Zager Gary | $225,000 |
Source: Public Records
Tax History Compared to Growth
Tax History
| Year | Tax Paid | Tax Assessment Tax Assessment Total Assessment is a certain percentage of the fair market value that is determined by local assessors to be the total taxable value of land and additions on the property. | Land | Improvement |
|---|---|---|---|---|
| 2025 | $5,943 | $523,619 | $394,491 | $129,128 |
| 2024 | $5,943 | $513,352 | $386,755 | $126,597 |
| 2023 | $5,726 | $503,287 | $379,172 | $124,115 |
| 2022 | $5,624 | $493,419 | $371,737 | $121,682 |
| 2021 | $5,517 | $483,745 | $364,448 | $119,297 |
| 2020 | $5,463 | $478,785 | $360,711 | $118,074 |
| 2019 | $5,357 | $469,398 | $353,639 | $115,759 |
| 2018 | $5,252 | $460,195 | $346,705 | $113,490 |
| 2017 | $5,160 | $451,172 | $339,907 | $111,265 |
| 2016 | $5,047 | $442,326 | $333,242 | $109,084 |
| 2015 | $4,996 | $435,682 | $328,236 | $107,446 |
| 2014 | $4,878 | $427,148 | $321,806 | $105,342 |
Source: Public Records
Map
Nearby Homes
- 2516 Bayside Dr
- 435 Fernleaf Ave Unit 1
- 407 1/2 Goldenrod Ave
- 429 Dahlia Ave
- 303 Goldenrod Ave
- 302 Carnation Ave
- 508 Goldenrod Ave
- 412 Heliotrope Ave
- 2501 Seaview Ave
- 509 Carnation Ave
- 2614 Ocean Blvd
- 221 Carnation Ave
- 516 1/2 Larkspur (Rear Home) Ave
- 220 Carnation Ave
- 1 Iris Ave
- 212 Goldenrod Ave
- 411 Jasmine Ave
- 604 Begonia Ave
- 2525 Ocean Blvd Unit C-1
- 2495 Ocean Blvd
- 417 1/2 Fernleaf Ave
- 417 Fernleaf Ave Unit 1/2
- 417 Fernleaf Ave
- 417 Fernleaf (View)
- 417 5 Fernleaf Ave
- 415 Fernleaf Ave
- 423 1/2 Fernleaf Ave
- 421 Fernleaf Ave Unit B
- 421 Fernleaf Ave
- 2630 1st Ave
- 413 Fernleaf Ave Unit 1
- 413 1/2 Fernleaf Ave Unit 2
- 423 Fernleaf Ave
- 424 1/2 Fernleaf Ave
- 411 Fernleaf Ave
- 418 Dahlia Ave
- 425 Fernleaf Ave Unit 1/2
- 425 Fernleaf Ave Unit 1
- 425 1/2 Fernleaf Ave
- 416 Dahlia Ave Unit A-1