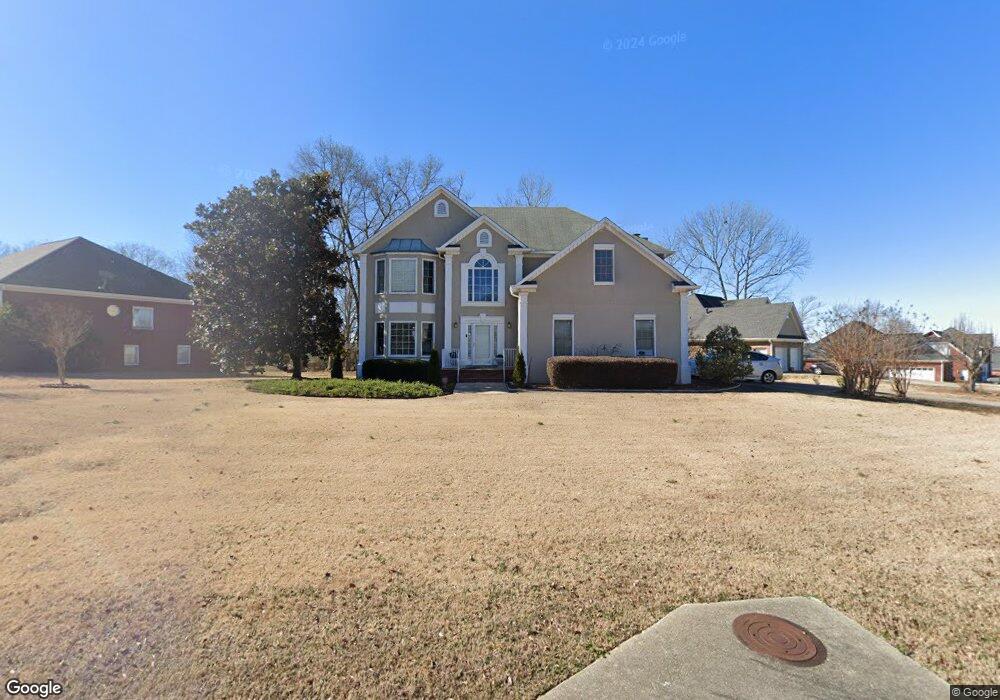
419 Greystone Ln Douglasville, GA 30134
Lithia Springs NeighborhoodEstimated Value: $355,962 - $436,000
4
Beds
3
Baths
2,628
Sq Ft
$146/Sq Ft
Est. Value
About This Home
This home is located at 419 Greystone Ln, Douglasville, GA 30134 and is currently estimated at $384,991, approximately $146 per square foot. 419 Greystone Ln is a home located in Douglas County with nearby schools including Beulah Elementary School, Turner Middle School, and Lithia Springs Comprehensive High School.
Ownership History
Date
Name
Owned For
Owner Type
Purchase Details
Closed on
Jun 21, 2014
Sold by
Booker-Mcneill Sabrina
Bought by
Booker-Mcneaill Sabrina and Mcneill Derrick
Current Estimated Value
Home Financials for this Owner
Home Financials are based on the most recent Mortgage that was taken out on this home.
Original Mortgage
$127,200
Outstanding Balance
$96,715
Interest Rate
4.19%
Mortgage Type
New Conventional
Estimated Equity
$288,276
Purchase Details
Closed on
Aug 18, 2009
Sold by
Carder Timothy C and Carder Grete R
Bought by
Mcneill Sabrina B
Home Financials for this Owner
Home Financials are based on the most recent Mortgage that was taken out on this home.
Original Mortgage
$137,464
Interest Rate
5.14%
Mortgage Type
FHA
Purchase Details
Closed on
Sep 29, 1995
Sold by
Sibley Martinbldrs
Bought by
Carder Timothy Greto
Create a Home Valuation Report for This Property
The Home Valuation Report is an in-depth analysis detailing your home's value as well as a comparison with similar homes in the area
Home Values in the Area
Average Home Value in this Area
Purchase History
| Date | Buyer | Sale Price | Title Company |
|---|---|---|---|
| Booker-Mcneaill Sabrina | -- | -- | |
| Mcneill Sabrina B | $140,000 | -- | |
| Carder Timothy Greto | $153,900 | -- | |
| Carder Timothy C Grete R | $153,900 | -- |
Source: Public Records
Mortgage History
| Date | Status | Borrower | Loan Amount |
|---|---|---|---|
| Open | Booker-Mcneaill Sabrina | $127,200 | |
| Previous Owner | Mcneill Sabrina B | $137,464 | |
| Closed | Carder Timothy C Grete R | $0 |
Source: Public Records
Tax History Compared to Growth
Tax History
| Year | Tax Paid | Tax Assessment Tax Assessment Total Assessment is a certain percentage of the fair market value that is determined by local assessors to be the total taxable value of land and additions on the property. | Land | Improvement |
|---|---|---|---|---|
| 2024 | $3,956 | $123,680 | $11,000 | $112,680 |
| 2023 | $3,956 | $123,680 | $11,000 | $112,680 |
| 2022 | $4,092 | $123,680 | $11,000 | $112,680 |
| 2021 | $2,902 | $87,000 | $9,240 | $77,760 |
| 2020 | $2,941 | $87,000 | $9,240 | $77,760 |
| 2019 | $2,683 | $84,840 | $9,240 | $75,600 |
| 2018 | $2,779 | $87,520 | $9,760 | $77,760 |
| 2017 | $2,511 | $77,400 | $9,760 | $67,640 |
| 2016 | $2,544 | $77,120 | $10,200 | $66,920 |
| 2015 | $2,549 | $75,640 | $10,440 | $65,200 |
| 2014 | $2,247 | $65,200 | $9,680 | $55,520 |
| 2013 | -- | $52,000 | $9,320 | $42,680 |
Source: Public Records
Map
Nearby Homes
- 352 Greystone Ln
- 3934 Birdie Dr
- 00 Boyd Rd
- 11411 Veterans Memorial Hwy
- 4113 Maroney Mill Rd
- 716 W Spring Dr
- 771 N Burnt Hickory Rd
- 6776 Tralee Dr Unit 1
- 4611 Old Douglasville Rd
- 4442 Lamar Dr
- 426 N Burnt Hickory Rd
- 4361 Ben Hill Rd
- 7144 Carolyn Cir
- 561 Bearden Rd
- 567 Bearden Rd
- 571 Bearden Rd
- 930 Terrace Mill Dr
- 540 Boulder Park Dr
- 435 Greystone Ln
- 411 Greystone Ln Unit 3
- 443 Greystone Ln
- 4006 Birdie Dr
- 420 Greystone Ln
- 420 Greystone Ln Unit 7
- 403 Greystone Ln
- 428 Greystone Ln
- 436 Greystone Ln
- 408 Greystone Ln Unit 3
- 451 Greystone Ln Unit 3
- 4000 Birdie Dr
- 395 Greystone Ln
- 395 Greystone Ln Unit 29
- 444 Greystone Ln Unit 3
- 3995 Birdie Dr Unit 3
- 400 Greystone Ln Unit 3
- 459 Greystone Ln
- 3992 Birdie Dr
- 387 Greystone Ln