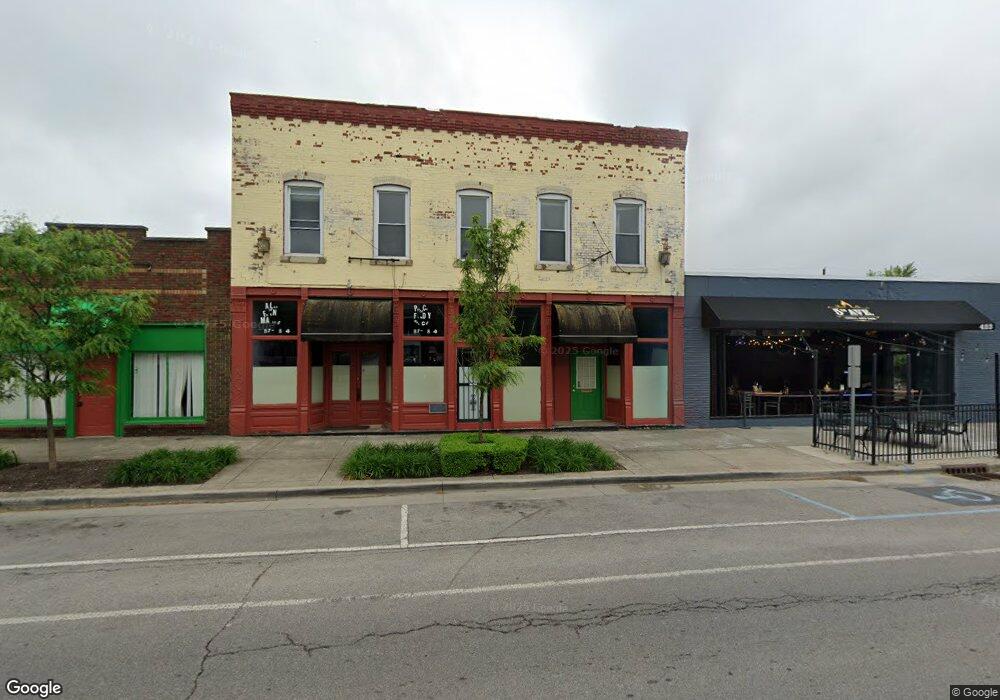
419 Main St Beech Grove, IN 46107
Estimated Value: $371,500
Studio
--
Bath
4,755
Sq Ft
$78/Sq Ft
Est. Value
About This Home
This home is located at 419 Main St, Beech Grove, IN 46107 and is currently estimated at $371,500, approximately $78 per square foot. 419 Main St is a home located in Marion County with nearby schools including Hornet Park Elementary School, Central Elementary School, and South Grove Intermediate School.
Ownership History
Date
Name
Owned For
Owner Type
Purchase Details
Closed on
Jul 8, 2025
Sold by
Cross David L
Bought by
Stoic Heights Llc
Current Estimated Value
Purchase Details
Closed on
Feb 28, 2014
Sold by
Henry Lawrence P and Henry Jennifer R
Bought by
Cross David L and Cross Marilyn J
Purchase Details
Closed on
Feb 2, 2006
Sold by
Shaffer Donald E
Bought by
Henry Lawrence P and Henry Jennifer R
Home Financials for this Owner
Home Financials are based on the most recent Mortgage that was taken out on this home.
Original Mortgage
$59,000
Interest Rate
6.37%
Mortgage Type
Future Advance Clause Open End Mortgage
Create a Home Valuation Report for This Property
The Home Valuation Report is an in-depth analysis detailing your home's value as well as a comparison with similar homes in the area
Home Values in the Area
Average Home Value in this Area
Purchase History
| Date | Buyer | Sale Price | Title Company |
|---|---|---|---|
| Stoic Heights Llc | $50,000 | None Listed On Document | |
| Cross David L | $100,000 | Lenders Escrow & Title | |
| Cross David L | -- | None Available | |
| Henry Lawrence P | -- | None Available |
Source: Public Records
Mortgage History
| Date | Status | Borrower | Loan Amount |
|---|---|---|---|
| Previous Owner | Henry Lawrence P | $59,000 |
Source: Public Records
Tax History
| Year | Tax Paid | Tax Assessment Tax Assessment Total Assessment is a certain percentage of the fair market value that is determined by local assessors to be the total taxable value of land and additions on the property. | Land | Improvement |
|---|---|---|---|---|
| 2025 | $4,062 | $137,400 | $49,300 | $88,100 |
| 2024 | $4,101 | $117,900 | $49,300 | $68,600 |
| 2023 | $4,101 | $117,900 | $49,300 | $68,600 |
| 2022 | $4,189 | $117,900 | $49,300 | $68,600 |
| 2021 | $3,754 | $108,600 | $44,800 | $63,800 |
| 2020 | $3,452 | $109,000 | $44,800 | $64,200 |
| 2019 | $3,245 | $105,700 | $44,800 | $60,900 |
| 2018 | $3,156 | $105,800 | $44,800 | $61,000 |
| 2017 | $3,191 | $104,000 | $44,800 | $59,200 |
| 2016 | $3,112 | $102,300 | $44,800 | $57,500 |
| 2014 | $4,709 | $154,200 | $44,800 | $109,400 |
| 2013 | $4,709 | $154,200 | $44,800 | $109,400 |
Source: Public Records
Map
Nearby Homes
Your Personal Tour Guide
Ask me questions while you tour the home.