419 N 23rd St Murphysboro, IL 62966
Estimated Value: $40,270 - $70,000
1
Bed
--
Bath
660
Sq Ft
$85/Sq Ft
Est. Value
About This Home
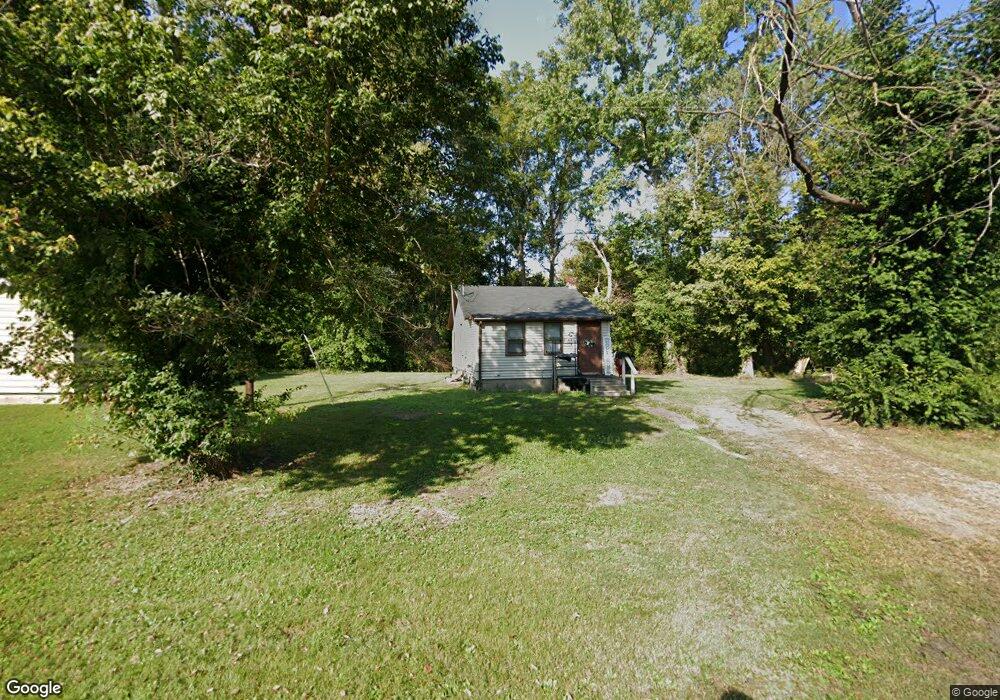
This home is located at 419 N 23rd St, Murphysboro, IL 62966 and is currently estimated at $56,068, approximately $84 per square foot. 419 N 23rd St is a home located in Jackson County with nearby schools including Murphysboro High School, Immanuel Lutheran School, and Murphysboro Christian Academy.
Create a Home Valuation Report for This Property
The Home Valuation Report is an in-depth analysis detailing your home's value as well as a comparison with similar homes in the area
Home Values in the Area
Average Home Value in this Area
Tax History Compared to Growth
Tax History
| Year | Tax Paid | Tax Assessment Tax Assessment Total Assessment is a certain percentage of the fair market value that is determined by local assessors to be the total taxable value of land and additions on the property. | Land | Improvement |
|---|---|---|---|---|
| 2024 | $716 | $6,979 | $1,635 | $5,344 |
| 2023 | $675 | $6,191 | $1,450 | $4,741 |
| 2022 | $642 | $5,675 | $1,329 | $4,346 |
| 2021 | $622 | $5,324 | $1,247 | $4,077 |
| 2020 | $626 | $5,260 | $1,232 | $4,028 |
| 2019 | $579 | $5,169 | $1,211 | $3,958 |
| 2018 | $742 | $7,052 | $1,211 | $5,841 |
| 2017 | $739 | $7,052 | $1,211 | $5,841 |
| 2016 | $721 | $7,052 | $1,211 | $5,841 |
| 2015 | -- | $7,052 | $1,211 | $5,841 |
| 2014 | -- | $7,462 | $1,211 | $6,251 |
| 2012 | -- | $7,462 | $1,211 | $6,251 |
Source: Public Records
Map
Nearby Homes
- 2120 Logan St
- 2142 Herbert St
- 2112 Herbert St
- 2381 Logan St
- 2004 Elm St
- 2101 Walnut St
- 1935 Elm St
- 2036 Spruce St
- 2435 W Walnut St
- 1933 Gartside St
- 1912 Hortense St
- 2009 Spruce St
- 2202 Illinois Ave Unit 3 & 4
- 2202 Illinois Ave Unit 1 & 2
- 1844 Spruce St
- 1808 Pine St
- 2119 Rains St
- 1826 Spruce St
- 2130 Rains St
- 2101 Dewey St