Estimated Value: $664,000 - $723,697
3
Beds
3
Baths
3,860
Sq Ft
$181/Sq Ft
Est. Value
About This Home
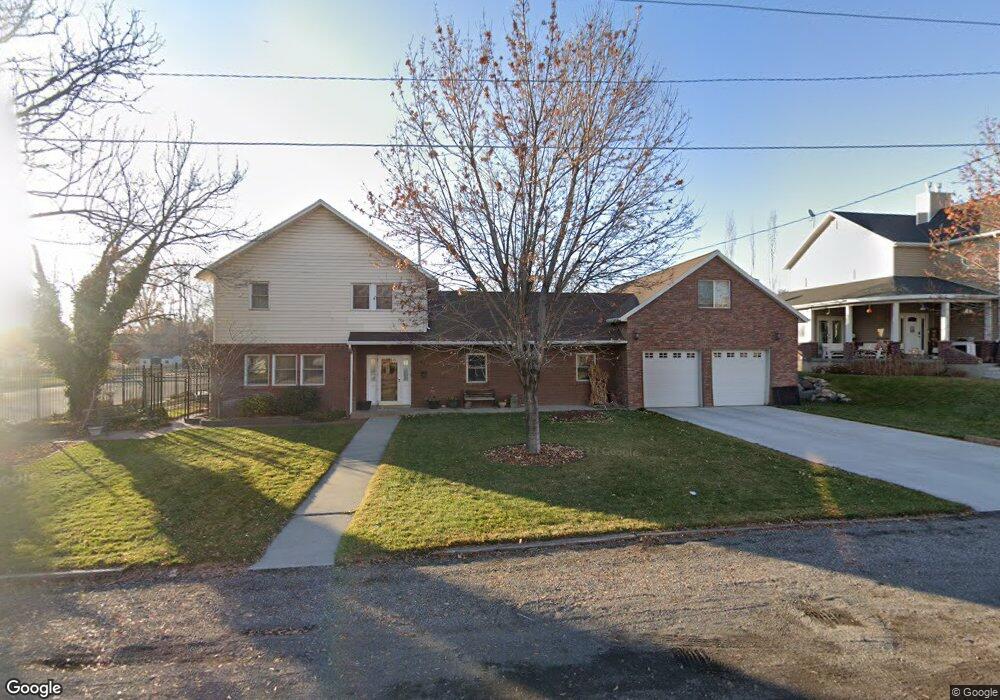
This home is located at 419 N 400 E, Lehi, UT 84043 and is currently estimated at $698,566, approximately $180 per square foot. 419 N 400 E is a home located in Utah County with nearby schools including Lehi Elementary School, Lehi Junior High School, and Lehi High School.
Ownership History
Date
Name
Owned For
Owner Type
Purchase Details
Closed on
Mar 9, 2020
Sold by
Allred Bradley J and Allred Juliene R
Bought by
Allred Bradley James and Allred Juliene
Current Estimated Value
Purchase Details
Closed on
Sep 27, 2016
Sold by
Allred Bradley J and Allred Juliene
Bought by
Allred Bradley J and Allred Juliene R
Purchase Details
Closed on
Dec 22, 1997
Sold by
Robinson Ada P
Bought by
Allred Bradley J and Allred Juliene
Home Financials for this Owner
Home Financials are based on the most recent Mortgage that was taken out on this home.
Original Mortgage
$110,000
Outstanding Balance
$18,593
Interest Rate
7.22%
Estimated Equity
$679,973
Purchase Details
Closed on
Apr 23, 1997
Sold by
Robinson Ada P
Bought by
Allred Bradley J and Allred Juliene R
Home Financials for this Owner
Home Financials are based on the most recent Mortgage that was taken out on this home.
Original Mortgage
$25,500
Interest Rate
7.86%
Create a Home Valuation Report for This Property
The Home Valuation Report is an in-depth analysis detailing your home's value as well as a comparison with similar homes in the area
Home Values in the Area
Average Home Value in this Area
Purchase History
| Date | Buyer | Sale Price | Title Company |
|---|---|---|---|
| Allred Bradley James | -- | None Available | |
| Allred Bradley J | -- | None Available | |
| Allred Bradley J | -- | -- | |
| Allred Bradley J | -- | Provo Land Title |
Source: Public Records
Mortgage History
| Date | Status | Borrower | Loan Amount |
|---|---|---|---|
| Open | Allred Bradley J | $110,000 | |
| Previous Owner | Allred Bradley J | $25,500 |
Source: Public Records
Tax History
| Year | Tax Paid | Tax Assessment Tax Assessment Total Assessment is a certain percentage of the fair market value that is determined by local assessors to be the total taxable value of land and additions on the property. | Land | Improvement |
|---|---|---|---|---|
| 2025 | $2,796 | $352,385 | -- | -- |
| 2024 | $2,796 | $327,195 | $0 | $0 |
| 2023 | $2,678 | $340,230 | $0 | $0 |
| 2022 | $2,376 | $292,655 | $0 | $0 |
| 2021 | $2,156 | $401,600 | $105,300 | $296,300 |
| 2020 | $2,034 | $374,400 | $97,500 | $276,900 |
| 2019 | $2,173 | $415,900 | $97,500 | $318,400 |
| 2018 | $2,182 | $394,800 | $89,100 | $305,700 |
| 2017 | $1,537 | $147,785 | $0 | $0 |
| 2016 | $1,500 | $133,815 | $0 | $0 |
| 2015 | $1,406 | $119,130 | $0 | $0 |
| 2014 | $1,278 | $107,580 | $0 | $0 |
Source: Public Records
Map
Nearby Homes
- 428 E 500 N
- 595 S 600 E
- 171 E 400 N
- 281 N Center St
- 395 N 100 W
- 807 N Somerset Aly
- 832 N Somerset Aly
- 890 N Whipple Dr
- 509 E 300 S
- 52 W State St
- 68 W State St
- 255 W 100 N
- 155 W State St Unit TRLR 3
- 762 S 450 E
- 406 W 600 N
- 430 N 470 W Unit 17
- 430 N 470 W Unit 29
- 197 W Harvest Ln
- 1150 N 200 W Unit 6
- 414 N 1322 E
Your Personal Tour Guide
Ask me questions while you tour the home.