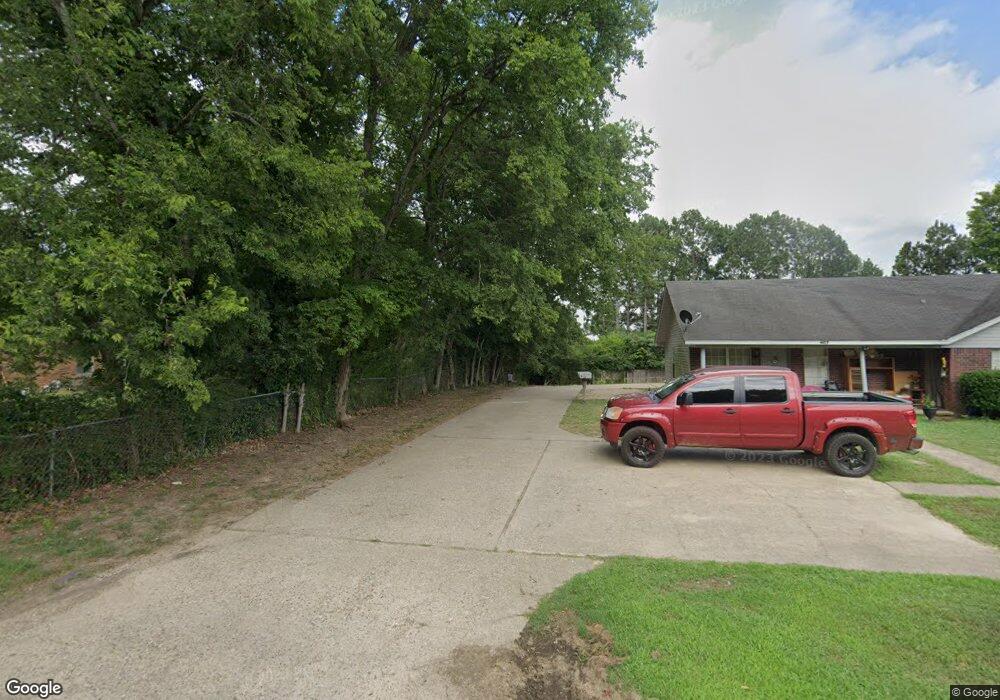
419 N 4th Benton, AR 72015
Estimated Value: $85,000 - $158,000
2
Beds
1
Bath
862
Sq Ft
$135/Sq Ft
Est. Value
About This Home
This home is located at 419 N 4th, Benton, AR 72015 and is currently estimated at $116,762, approximately $135 per square foot. 419 N 4th is a home located in Saline County with nearby schools including Angie Grant Elementary School, Benton Middle School, and Benton Junior High School.
Ownership History
Date
Name
Owned For
Owner Type
Purchase Details
Closed on
Oct 19, 2017
Sold by
Secretary Of Hud
Bought by
Central Arkansas Home Group Llc
Current Estimated Value
Purchase Details
Closed on
Jan 30, 2017
Sold by
Carrengton Mortgage Services Llc
Bought by
Secretary Of Hud
Purchase Details
Closed on
Dec 21, 2016
Sold by
Paulette Brandy L
Bought by
Carrington Mortgage Services Llc
Purchase Details
Closed on
Apr 28, 2009
Sold by
Lybrand Jim C and Lybrand Linda
Bought by
Paulette Brandy L
Home Financials for this Owner
Home Financials are based on the most recent Mortgage that was taken out on this home.
Original Mortgage
$67,034
Interest Rate
5.03%
Mortgage Type
FHA
Purchase Details
Closed on
Jan 27, 1999
Bought by
Babbs
Purchase Details
Closed on
Apr 17, 1995
Bought by
Richard Babbs
Create a Home Valuation Report for This Property
The Home Valuation Report is an in-depth analysis detailing your home's value as well as a comparison with similar homes in the area
Home Values in the Area
Average Home Value in this Area
Purchase History
| Date | Buyer | Sale Price | Title Company |
|---|---|---|---|
| Central Arkansas Home Group Llc | $44,100 | None Available | |
| Secretary Of Hud | -- | None Available | |
| Carrington Mortgage Services Llc | $51,660 | None Available | |
| Paulette Brandy L | $70,000 | -- | |
| Babbs | $17,000 | -- | |
| Richard Babbs | -- | -- |
Source: Public Records
Mortgage History
| Date | Status | Borrower | Loan Amount |
|---|---|---|---|
| Previous Owner | Paulette Brandy L | $67,034 |
Source: Public Records
Tax History Compared to Growth
Tax History
| Year | Tax Paid | Tax Assessment Tax Assessment Total Assessment is a certain percentage of the fair market value that is determined by local assessors to be the total taxable value of land and additions on the property. | Land | Improvement |
|---|---|---|---|---|
| 2025 | $504 | $9,104 | $1,326 | $7,778 |
| 2024 | $516 | $9,104 | $1,326 | $7,778 |
| 2023 | $504 | $9,104 | $1,326 | $7,778 |
| 2022 | $480 | $9,104 | $1,326 | $7,778 |
| 2021 | $436 | $7,870 | $1,330 | $6,540 |
| 2020 | $436 | $7,870 | $1,330 | $6,540 |
| 2019 | $436 | $7,870 | $1,330 | $6,540 |
| 2018 | $435 | $7,870 | $1,330 | $6,540 |
| 2017 | $435 | $7,870 | $1,330 | $6,540 |
| 2016 | $445 | $7,850 | $1,330 | $6,520 |
| 2015 | $87 | $7,850 | $1,330 | $6,520 |
| 2014 | $90 | $7,850 | $1,330 | $6,520 |
Source: Public Records
Map
Nearby Homes